How to start ArcGIS Pro and change Display Language to English
- You need to get license of using ArcGIS Pro.
- Launch "ArcGIS Pro" from the Windows Start Menu.
- Select "ArcGIS 組織サイトのURL" if this dialog box opened.
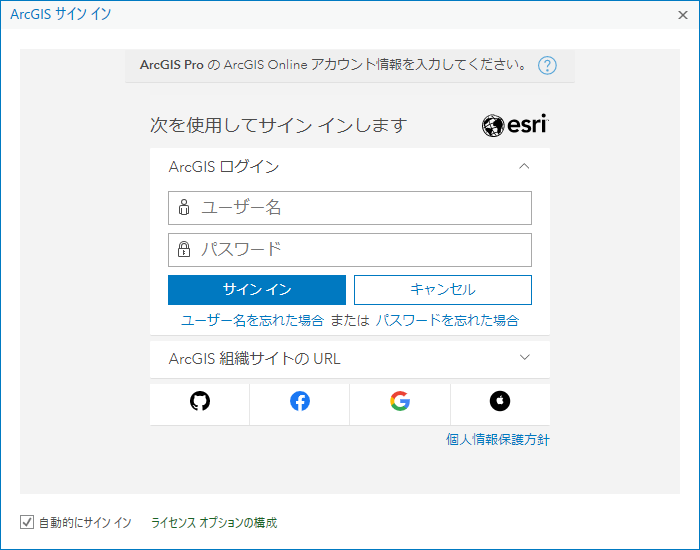
- Enter "u-tsukuba" in the ArcGIS 組織サイトのURL
- check "このURLを記憶” and "続行"

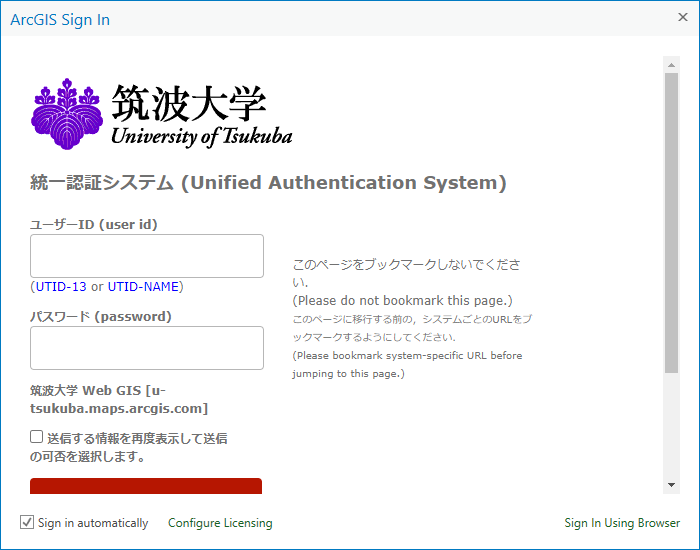
- Click "Univ. of Tsukuba" to connect the Unified Authentication System.

- Enter you user id and password.
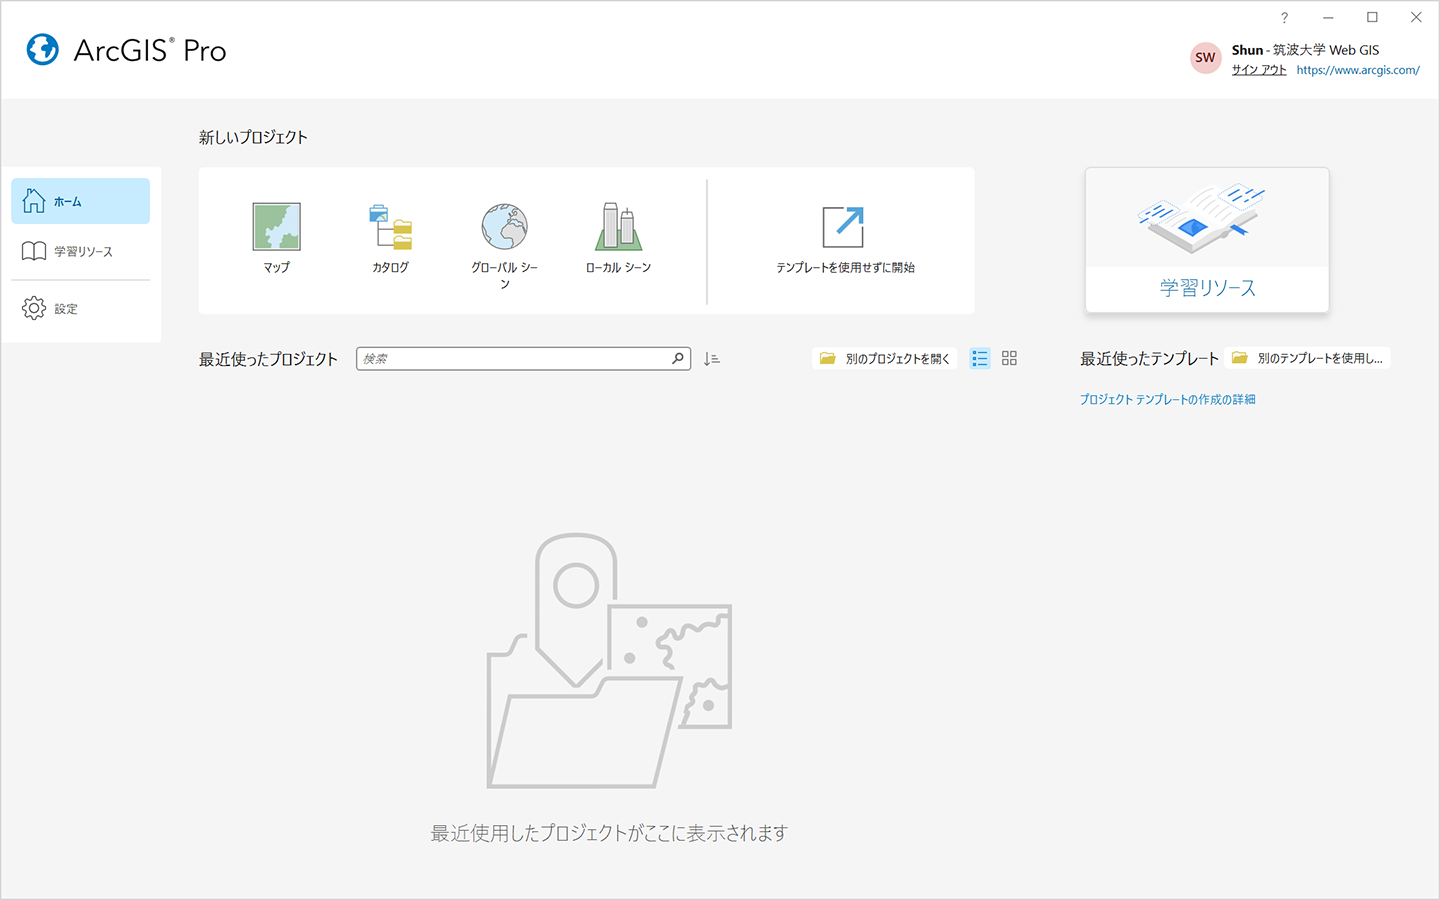
- ArcGIS Pro is launched.
- Click
 "設定" at the left bottom.
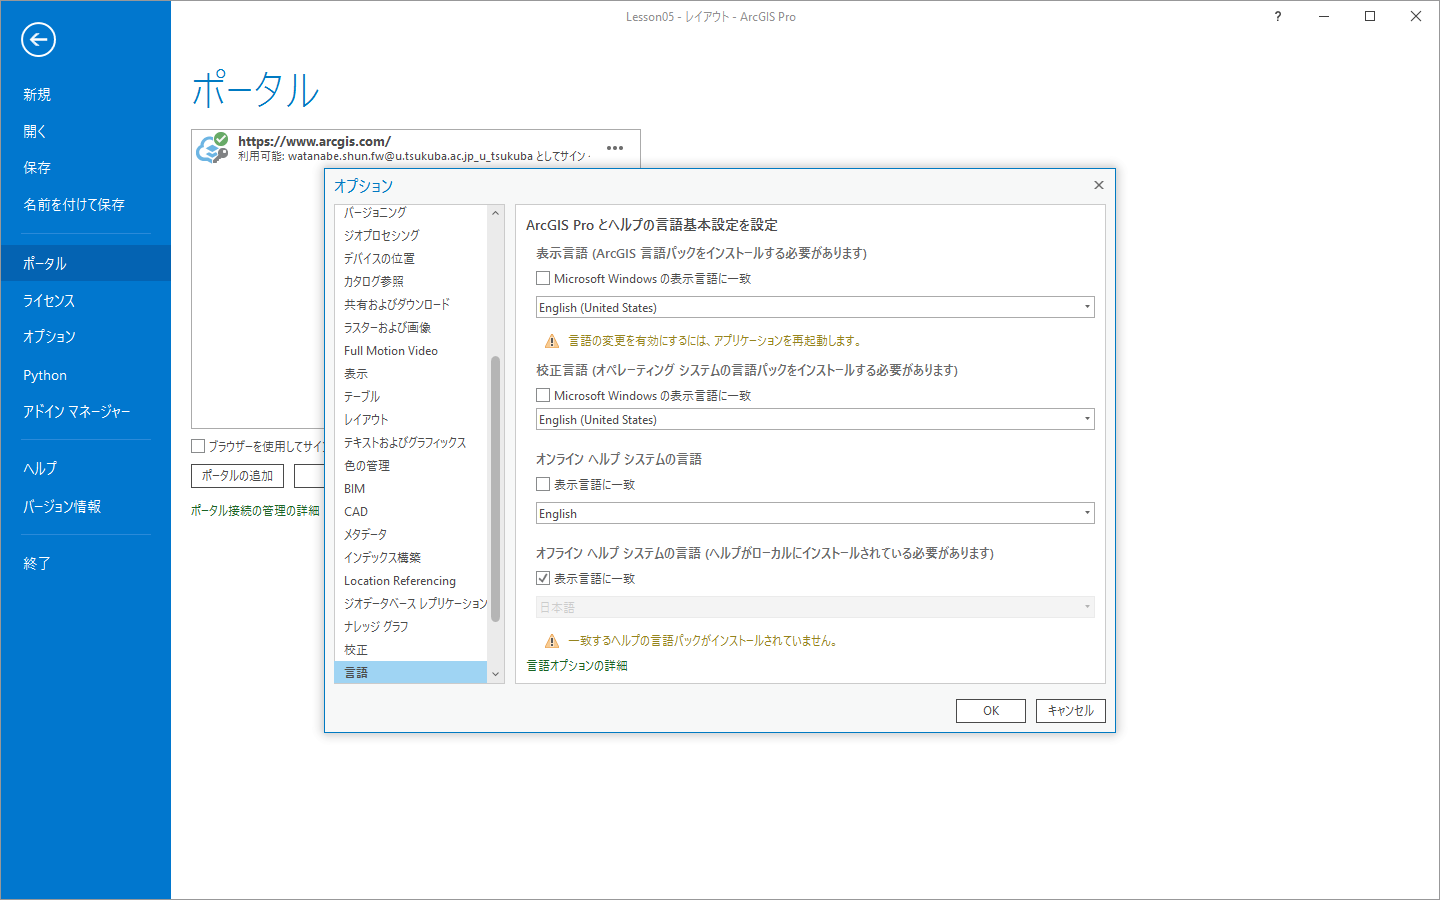
- Open "オプション” property and select "言語" in the menu.
- Change "表示言語" to English.
- "終了" to exit ArcGIS Pro once.
Exercise 1: Choropleth Map
- Download "This Zip File", and extract into "document/ArcGIS/Projects" folder of your home directory.
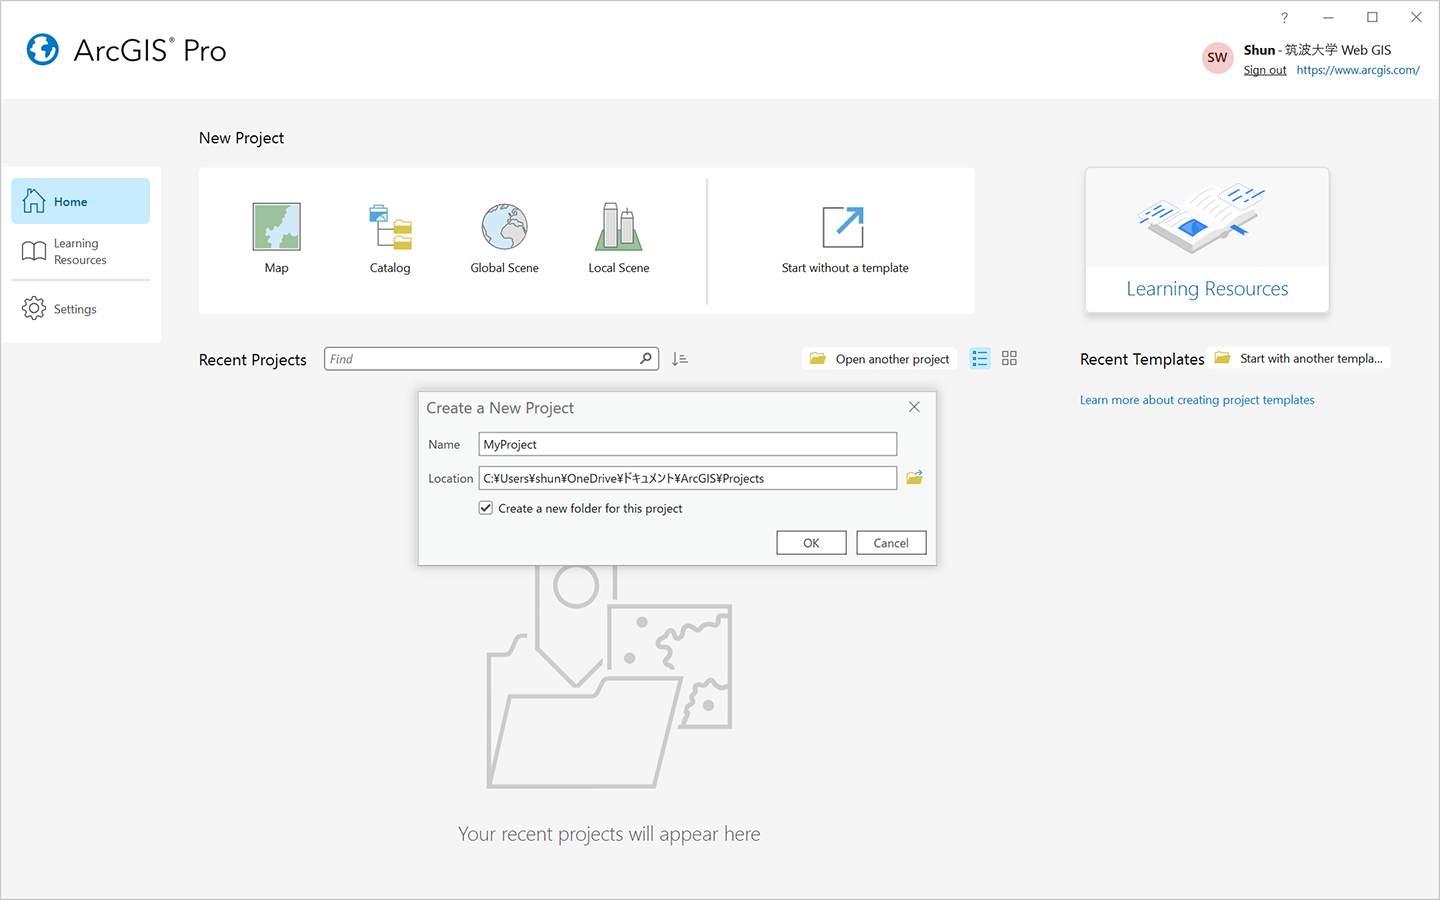
- Launch "ArcGIS Pro" from the Windows Start Menu. No need to authenticate after the second time.
- Click "Map" and give the name to create a New Project.
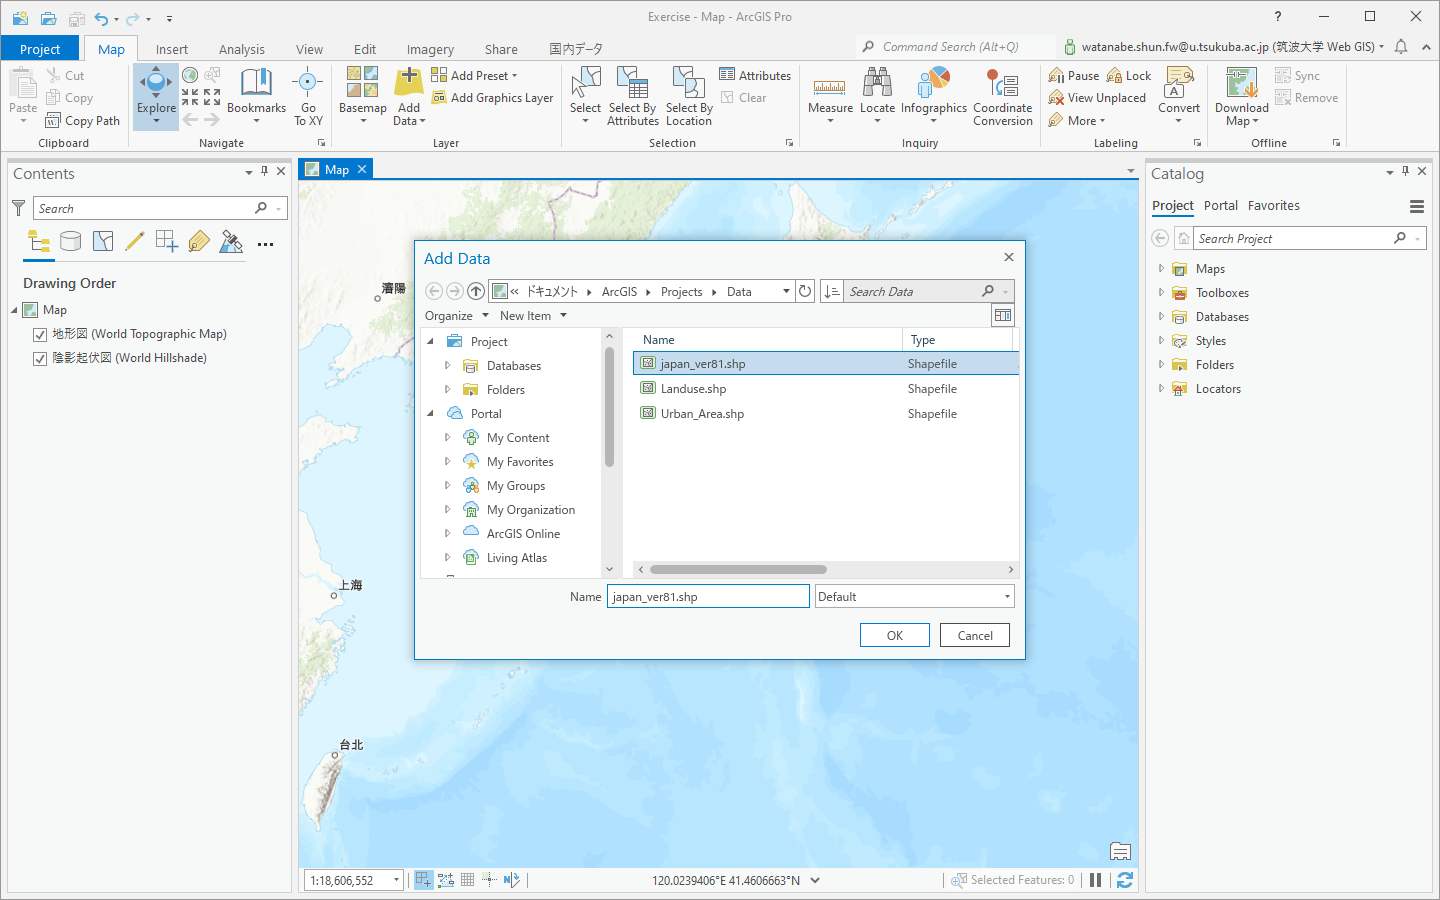
- Open "Add Data" dialog box from Map tab
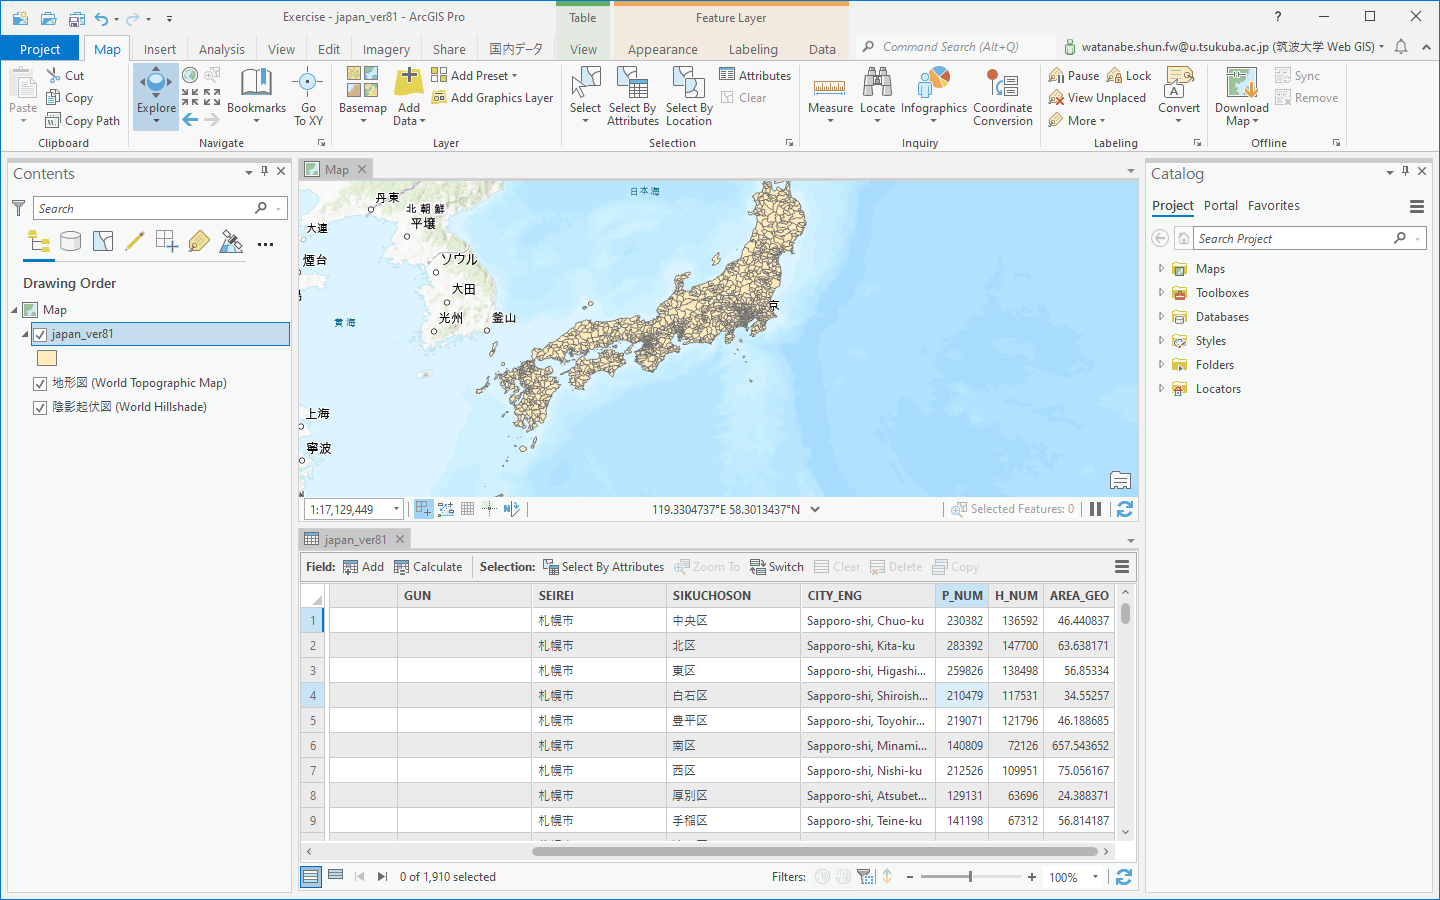
- Select "japan_ver81.shp" database, and add it to Contents window.
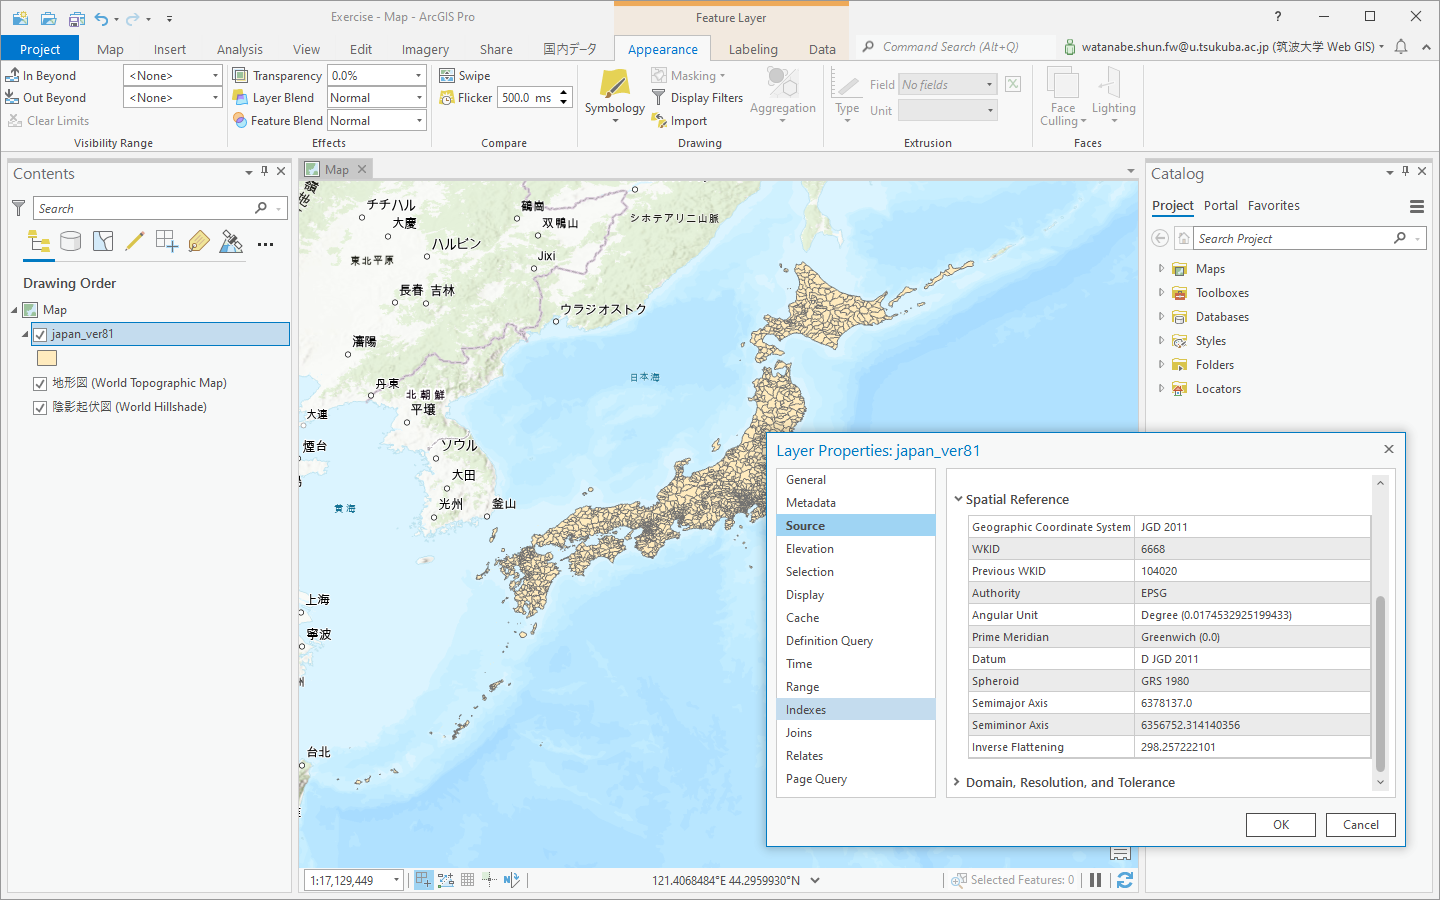
- Select "japan_ver81" in Contents window
- Open "Properties" from popup menu.
- Select "Source" in the menu and expand Spatial Reference.
- Confirm this data is constracted based on JGD 2011 (longitude and latitude)
- The map is also drawn according to JGD 2011
- Close Layer Properties.
- Select "japan_ver81" layer in Contents window.
- Open "Attribute Table" from popup menu.
- Confirm the fields in the Table, P_NUM = polulation, H_NUM = households
- Close the Table window.
- Select "japan_ver81" layer in Contents window.
- Select "Symbology" from popup menu.
- Select Graduated colors in Primary symboloty, and "P_NUM" or "H_NUM" for Fields.
- You can change the number of its classes.
- Confirm the map is rendered according to the number of municipalities' polulation or households.

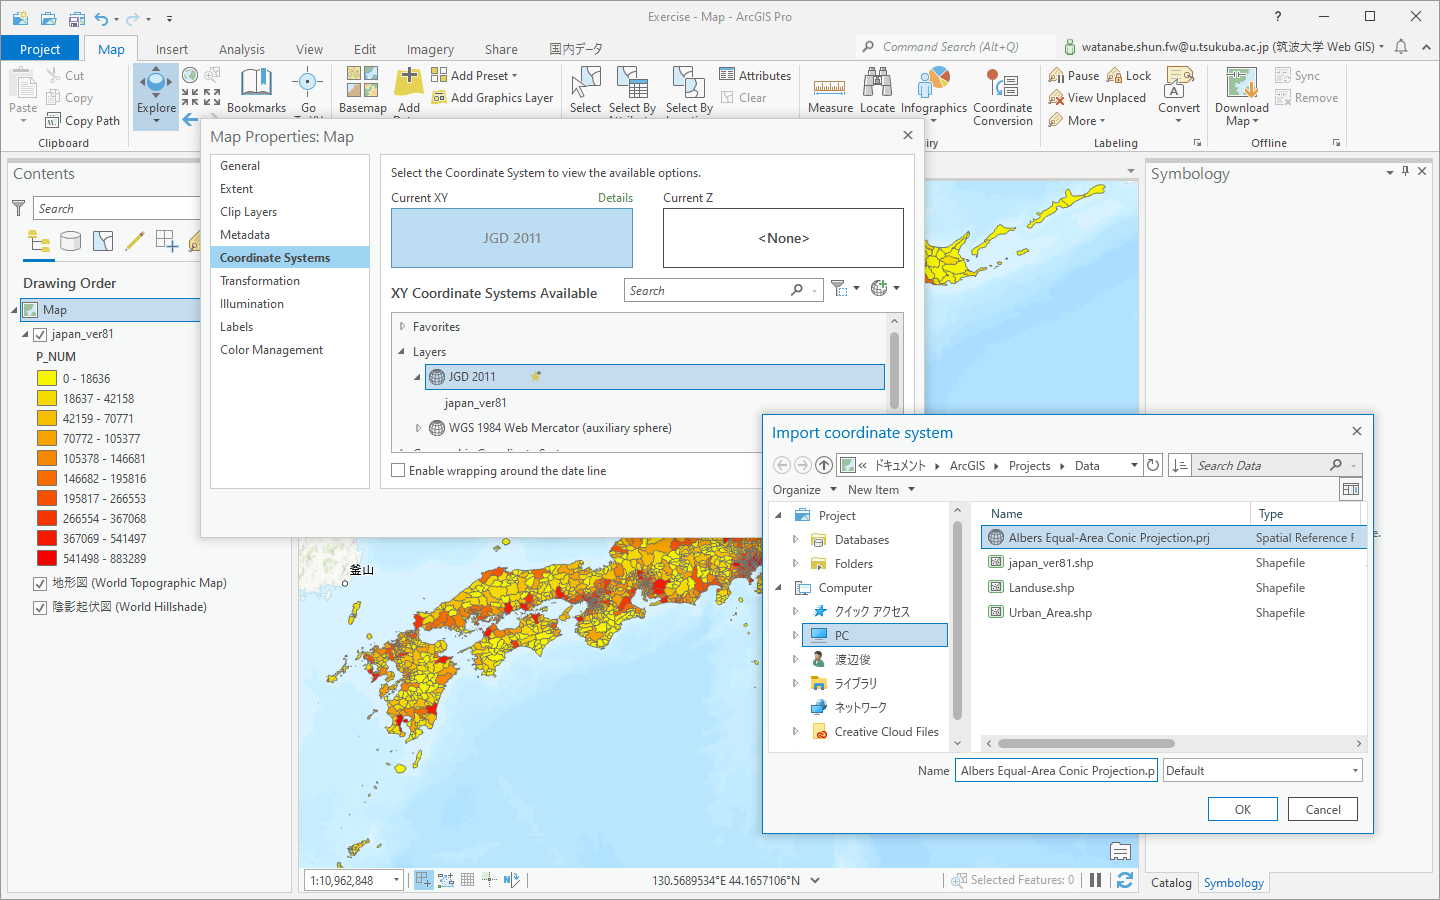
- Select "Map" in Contents window.
- Open "Properties" from popup menu
- Select "Coordinate Systems" in the menu
- Click
 to import "Albers Equal-Area Conic.prj" to change the projection.
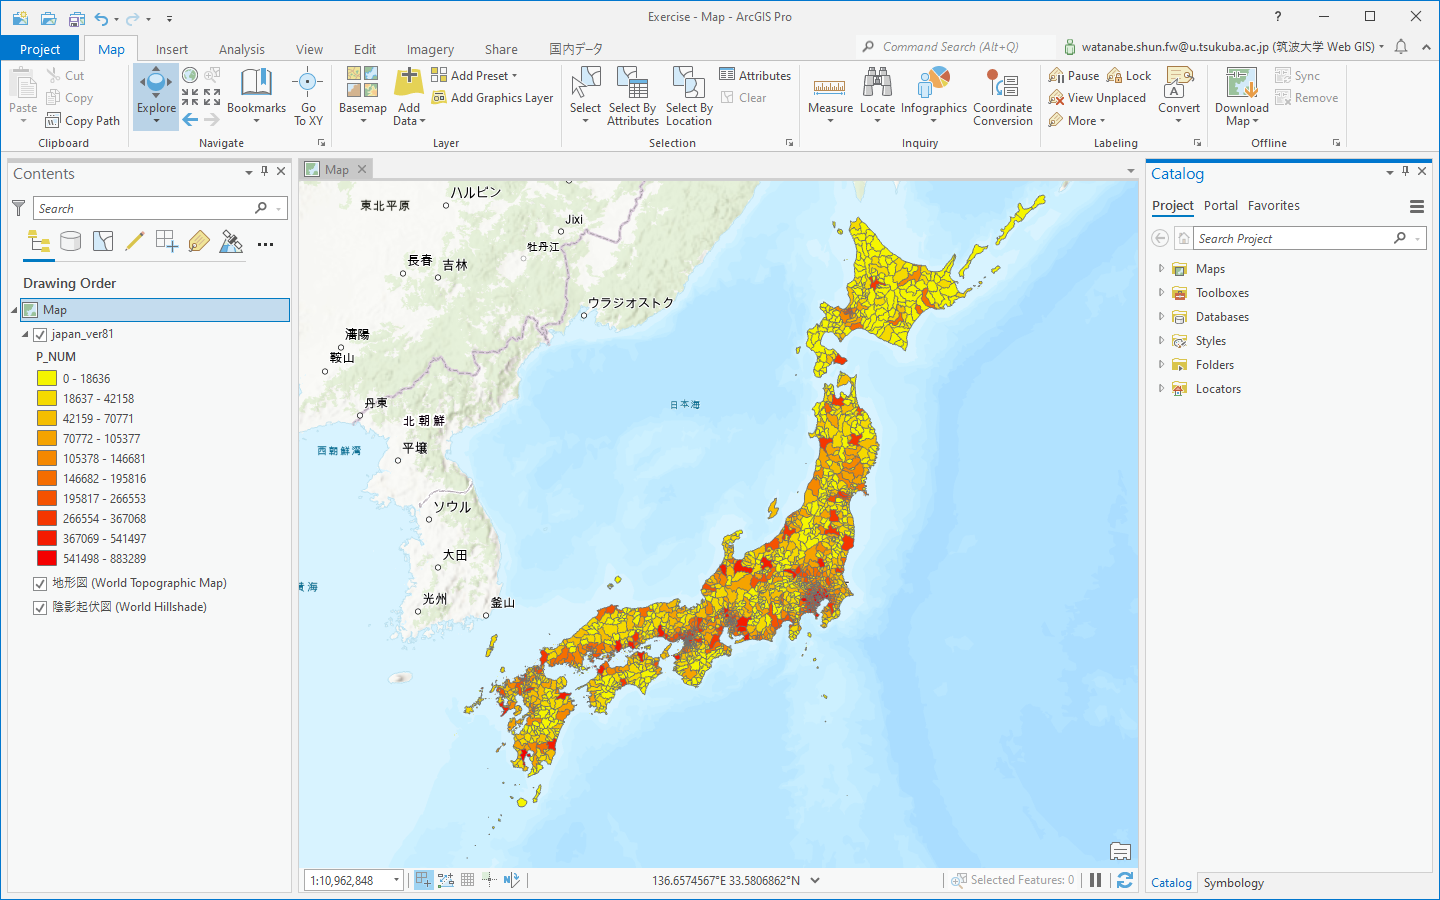
- Confirm the map is transformed according to the Albers Equal-Area Conic projection.
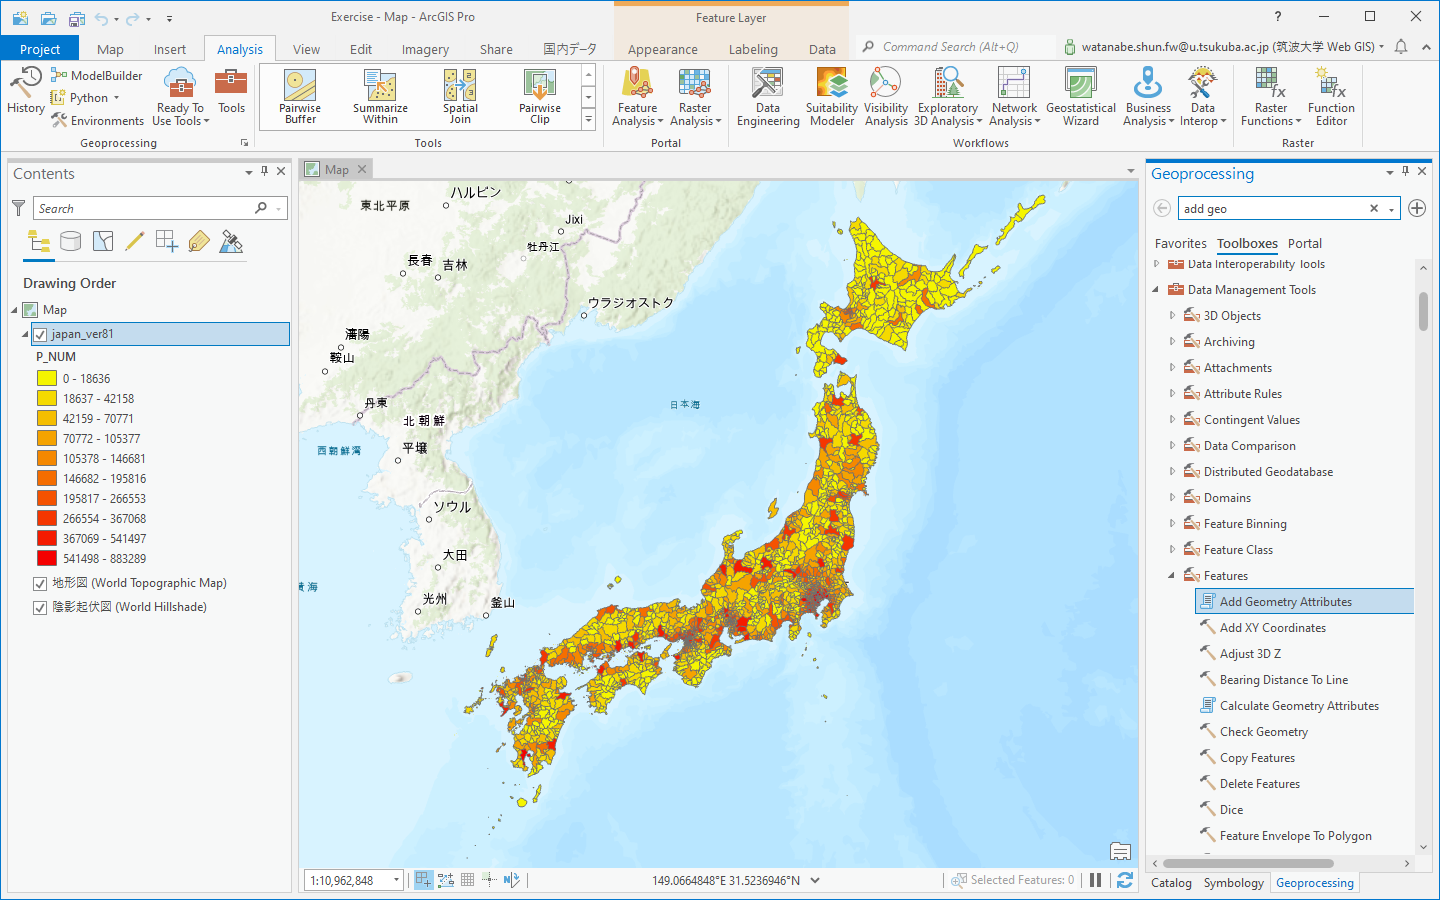
- Click "Tools" of Analysis tab to open Geoprocessing window.
- Select "Toolboxes" to list up Tools
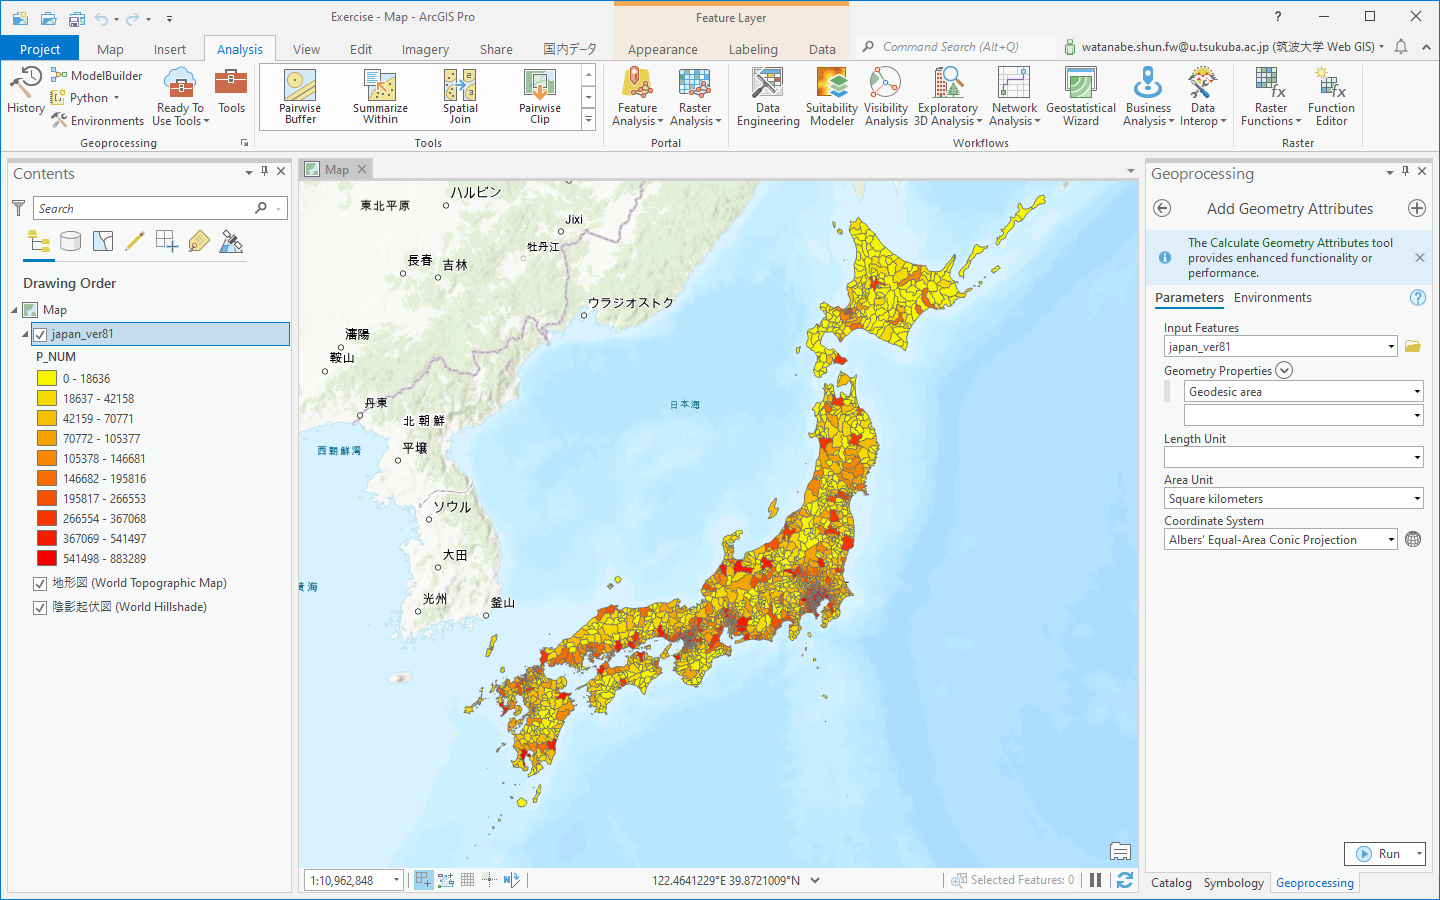
- Expand Data Management Tools / Featues and open "Add Geometry Attributes" window.
- Select "japan_ver81" as Input Features.
- Select "Geodesic area" as Geometry Properties.
- Select "Square Kilometers" as Area Unit.
- Select "GCS_JGD_2011" as Coordinate System.
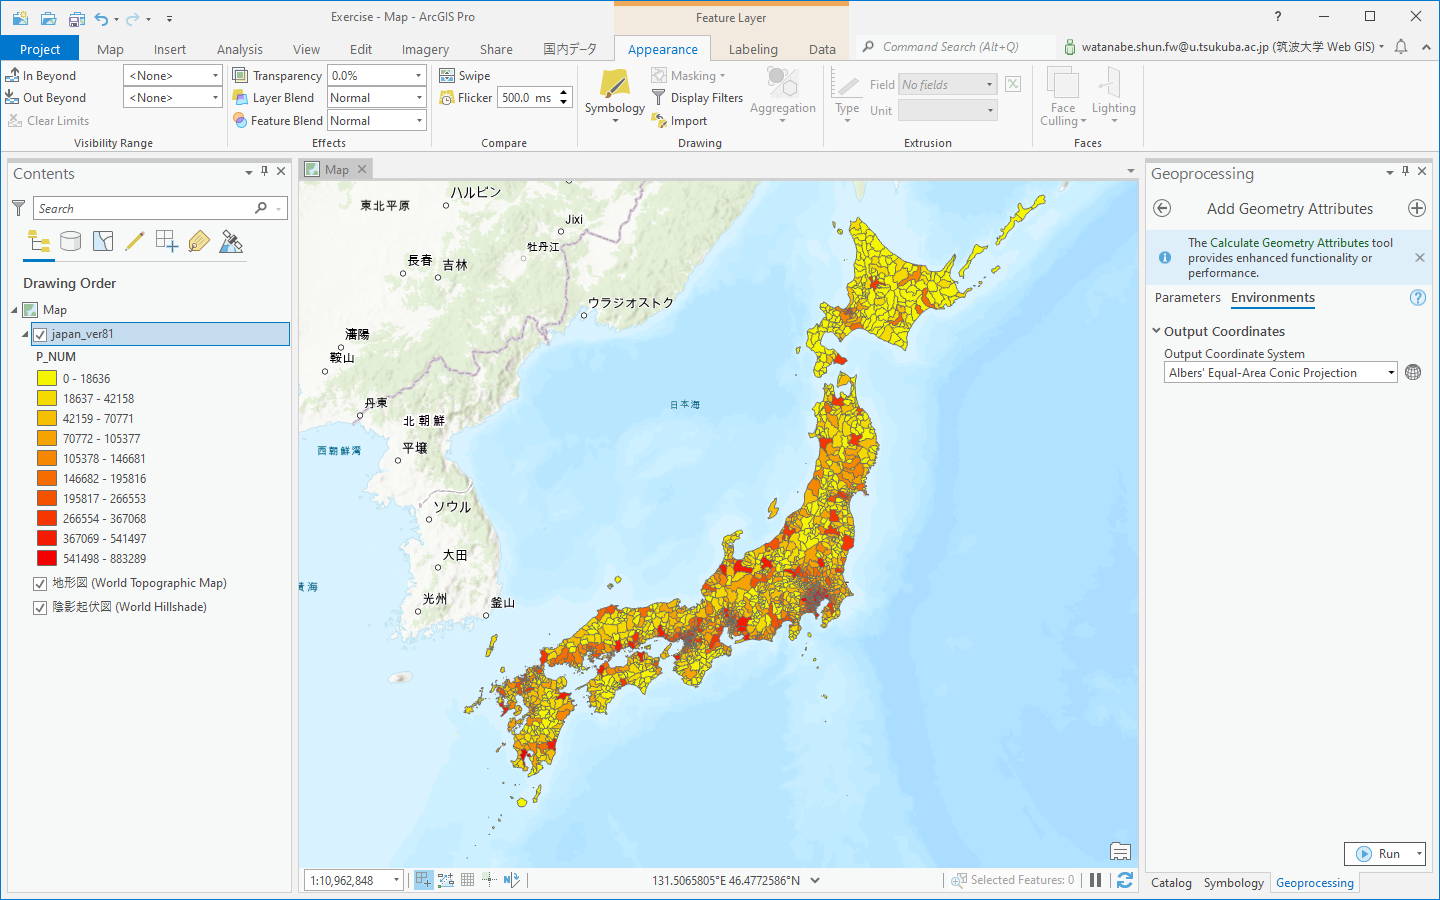
- Click "Environment" at the top of "Add Geometry Attributes" window.
- Select "Current Map[Map]" as Output Coortdinate System
- Run to calcuate the area of each municipalities.
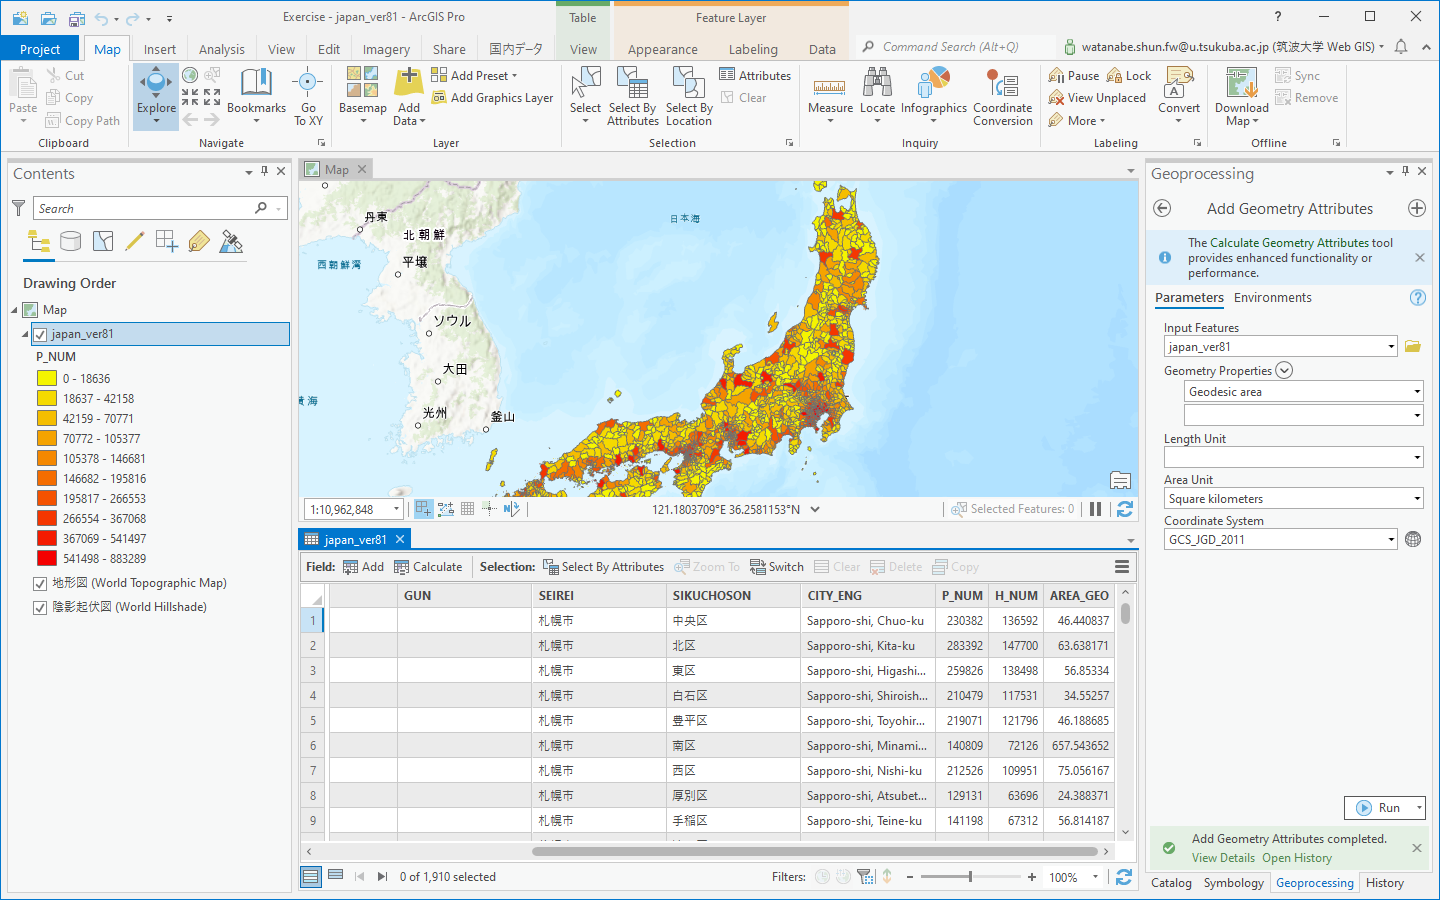
- Select "japan_ver81" layer in Contents window.
- Open "Attribute Table" from popup menu.
- Confirm the result in the AREA_GEO field.
- Close the Table window.
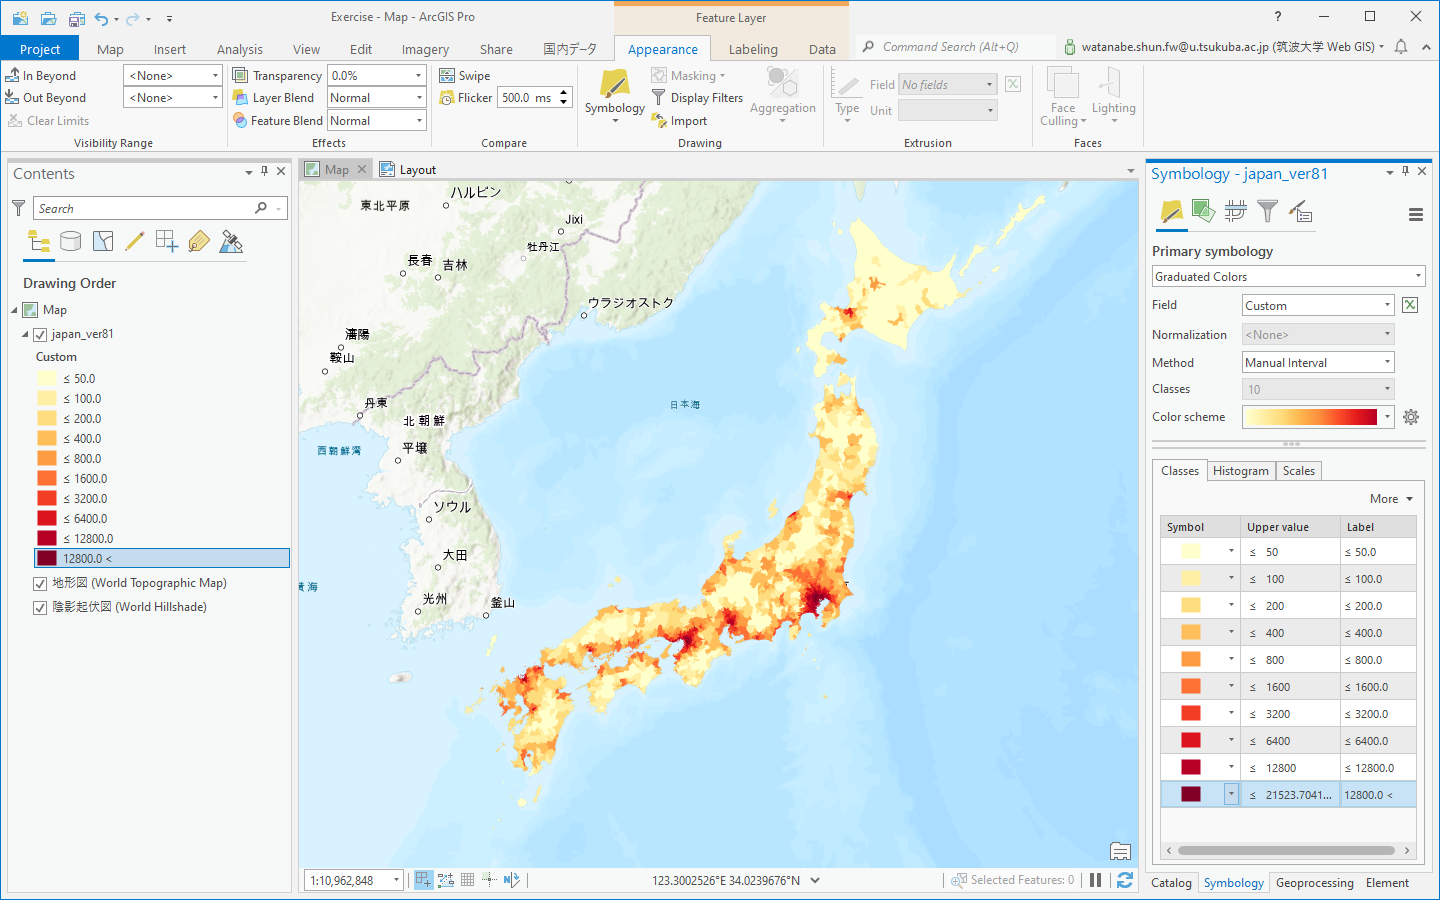
- Select "japan_ver81" layer in Contents window.
- Select "Symbology" from popup menu.
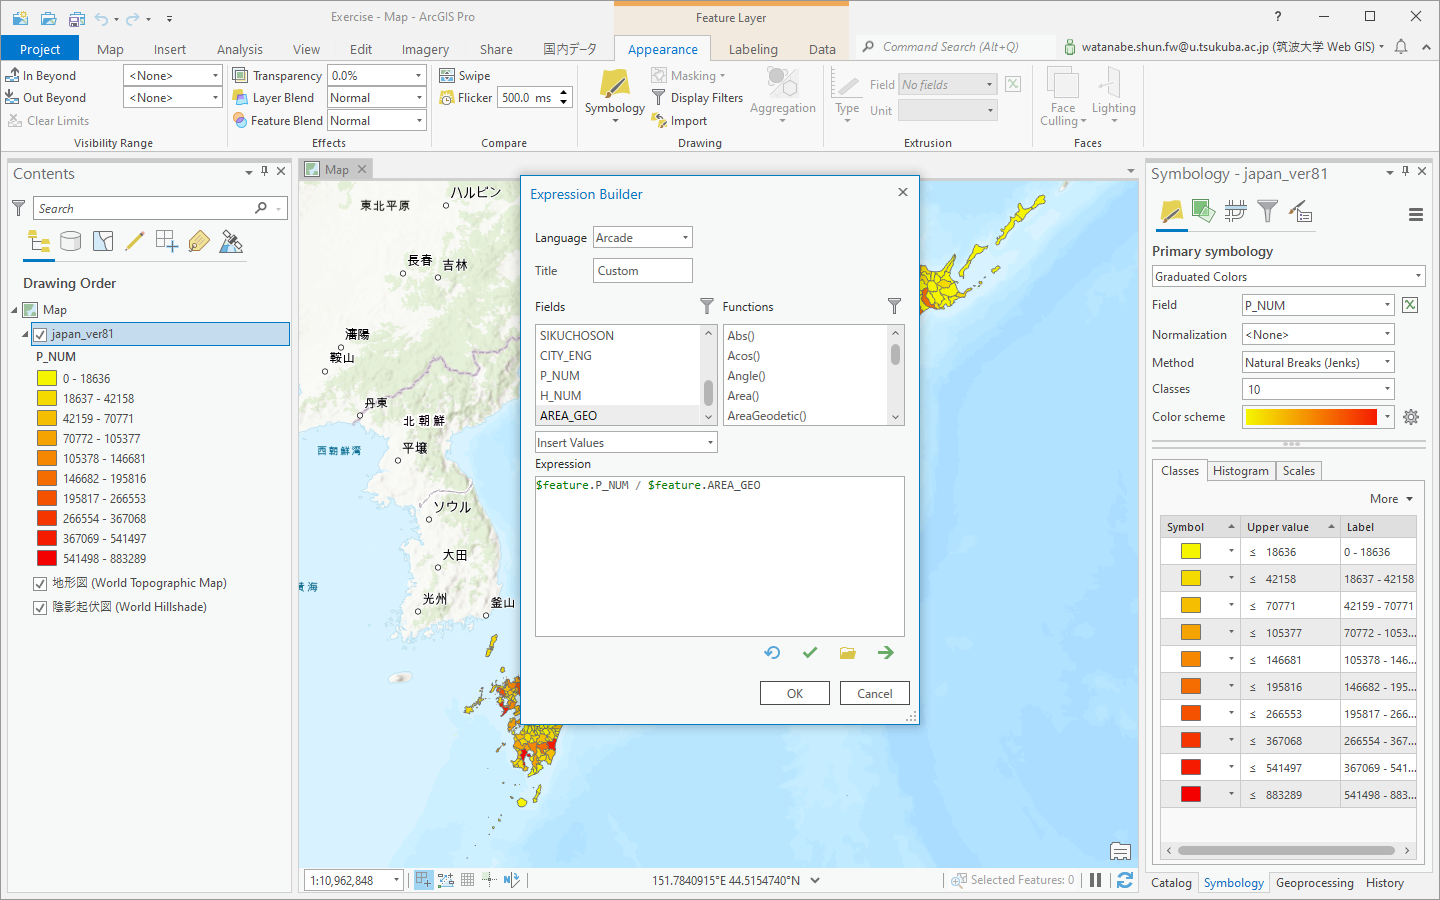
- Click
 to open Expression Builder dialog box
 - input the formula of population density ($feature.P_NUM / $feature.AREA_GEO)
- Confirm population distribution based on the polulation density.
- Modify Upper Values
- Change Color scheme as you like.
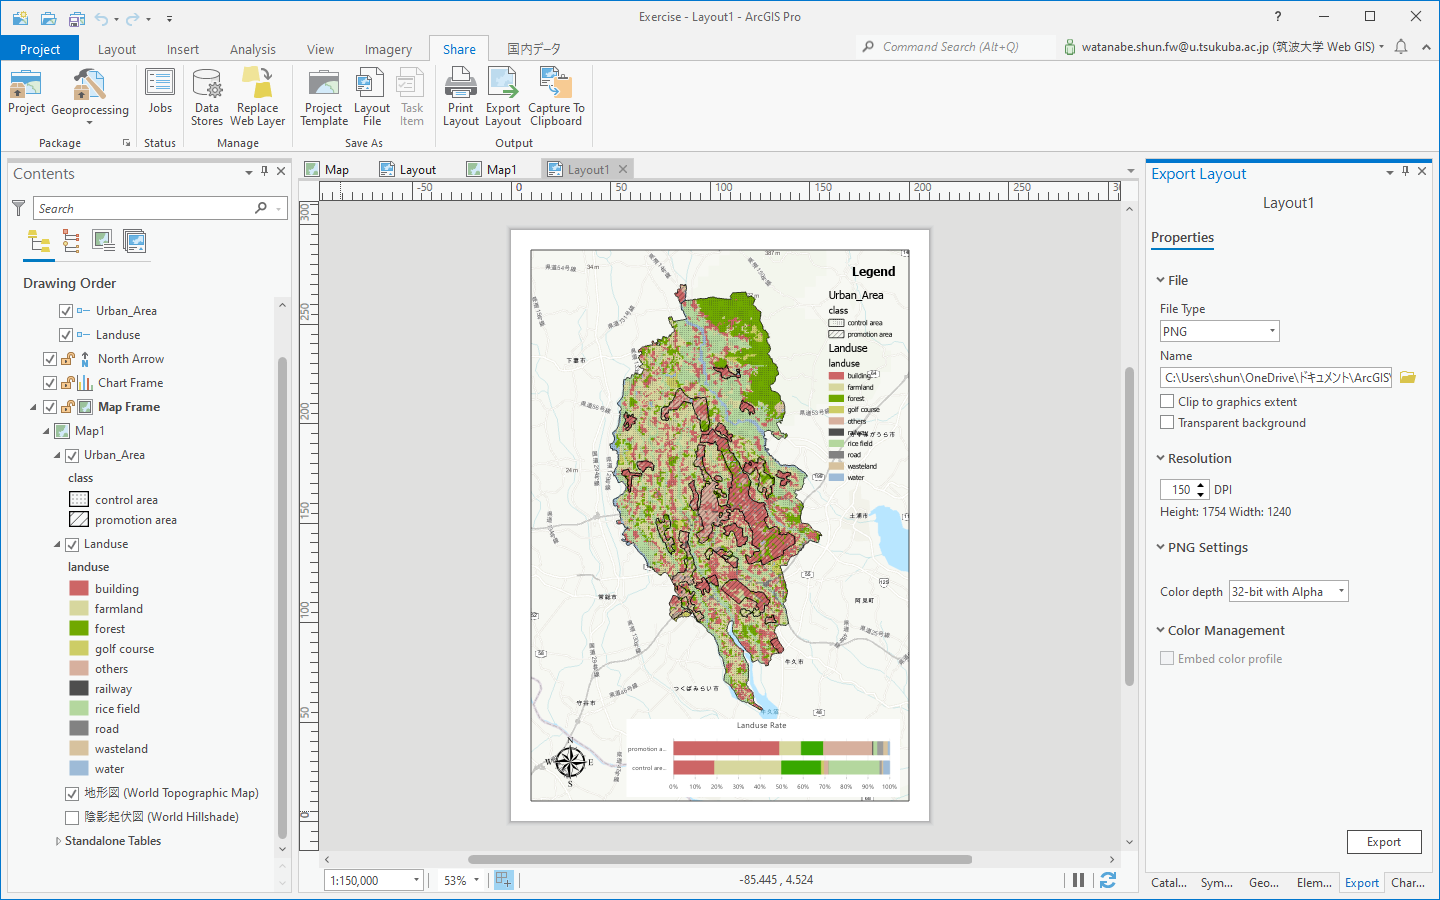
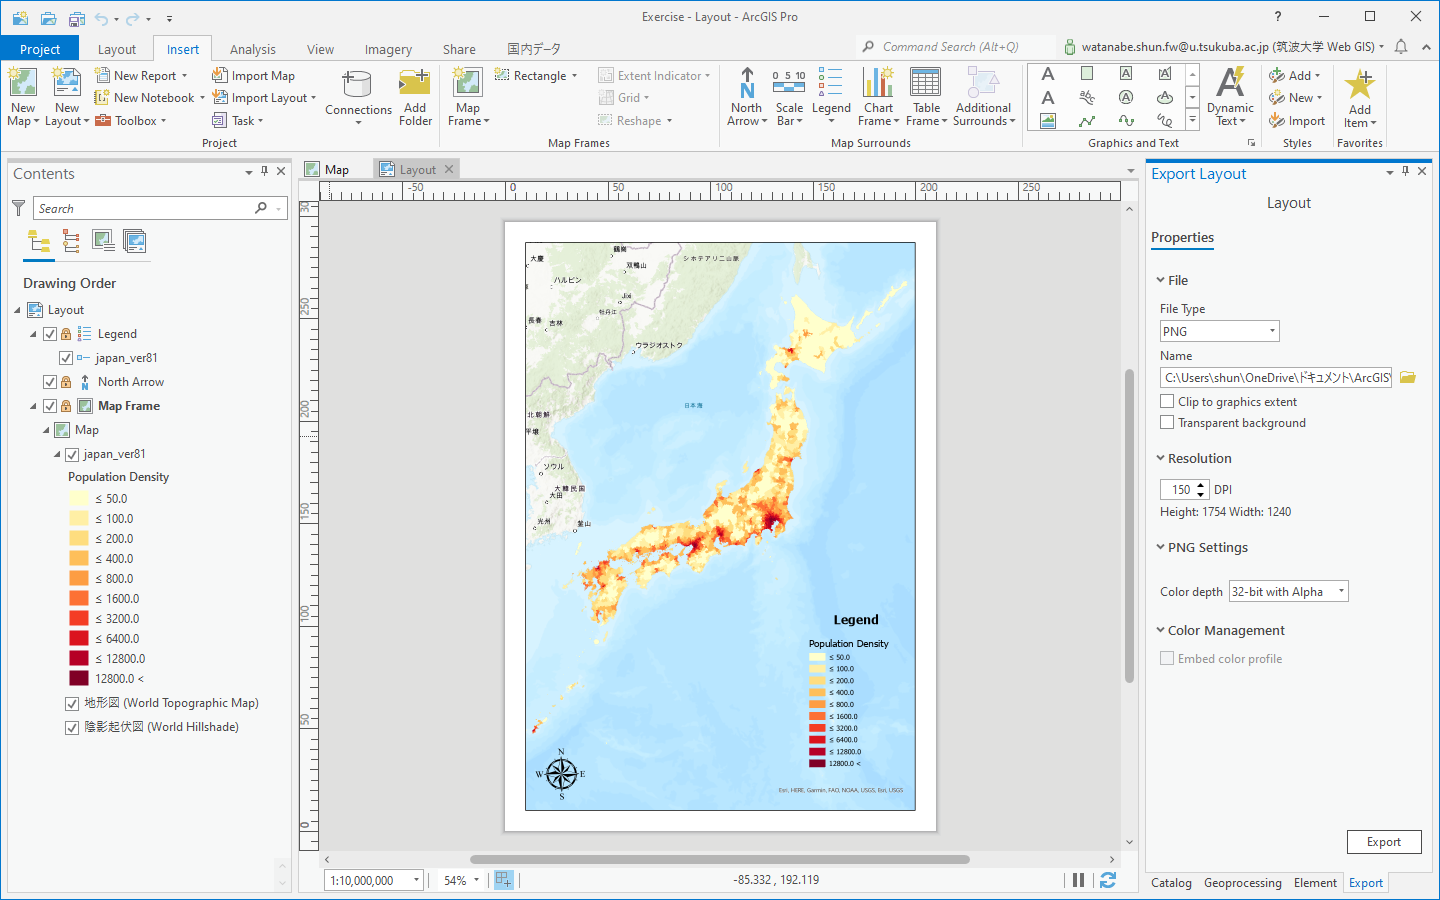
- Open "New Layout" of Insert tab and select ISO Portrait A4 .
- Select "Map Frame" and locat the map on the A4 paper.
- Insert "Legend", "North Arrow" to complete the Choropleth Map.
- Select "Export Output" of Share tab
- Name the file name and Export as PNG file.
- Submit the png file to manaba.
Exercise 2: Overlay Analysis and Cross Tabulation
- From "New Map" of Insert tab, make a New Map.
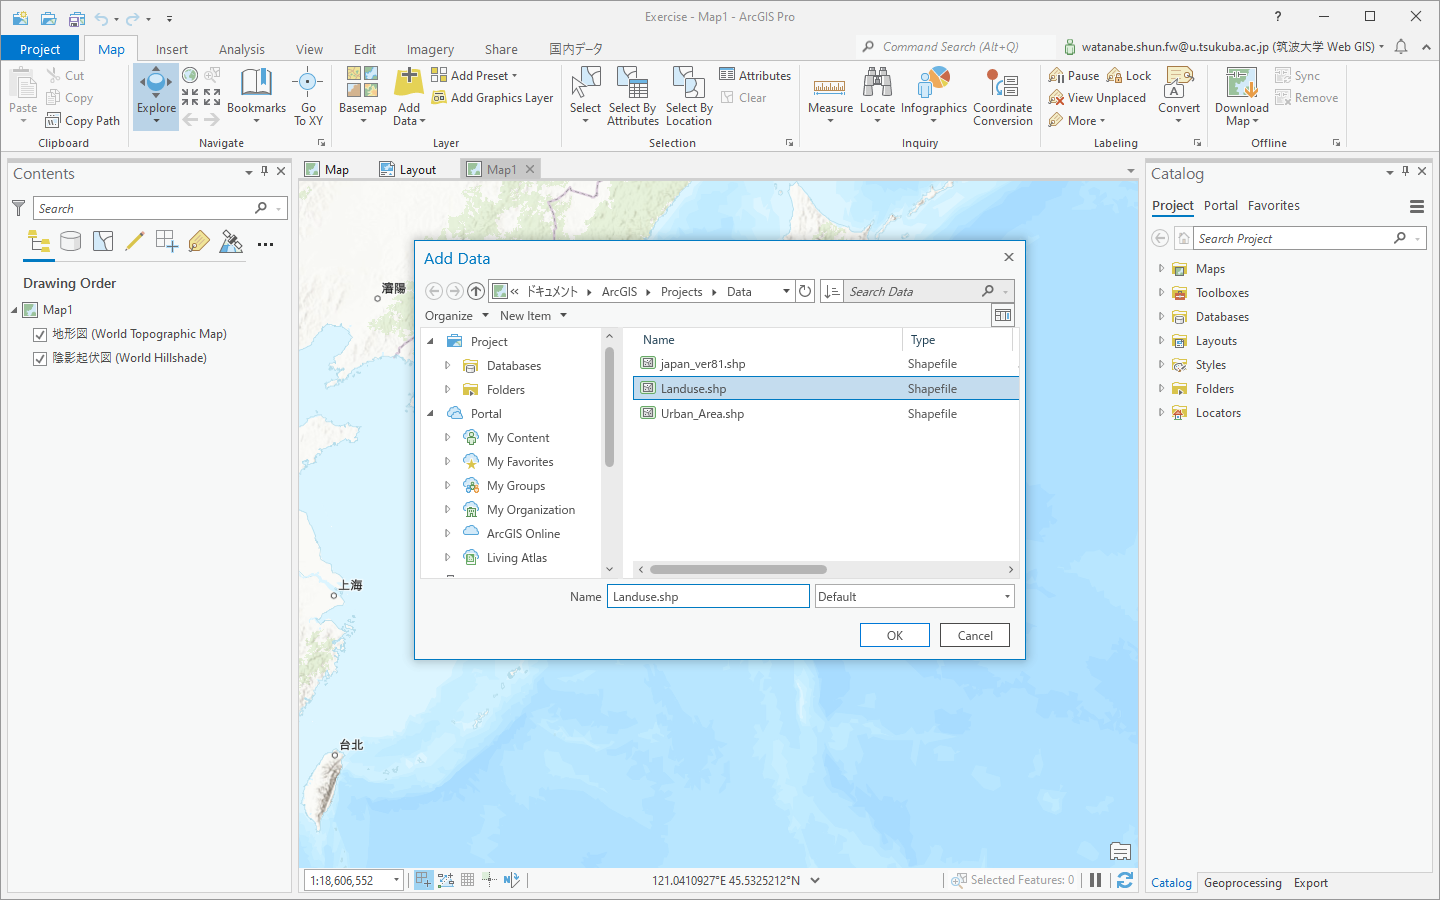
- Open Add Data dialog box from Map tab
- Select "Landuse.shp" database, and add it as a layer to Contents window.
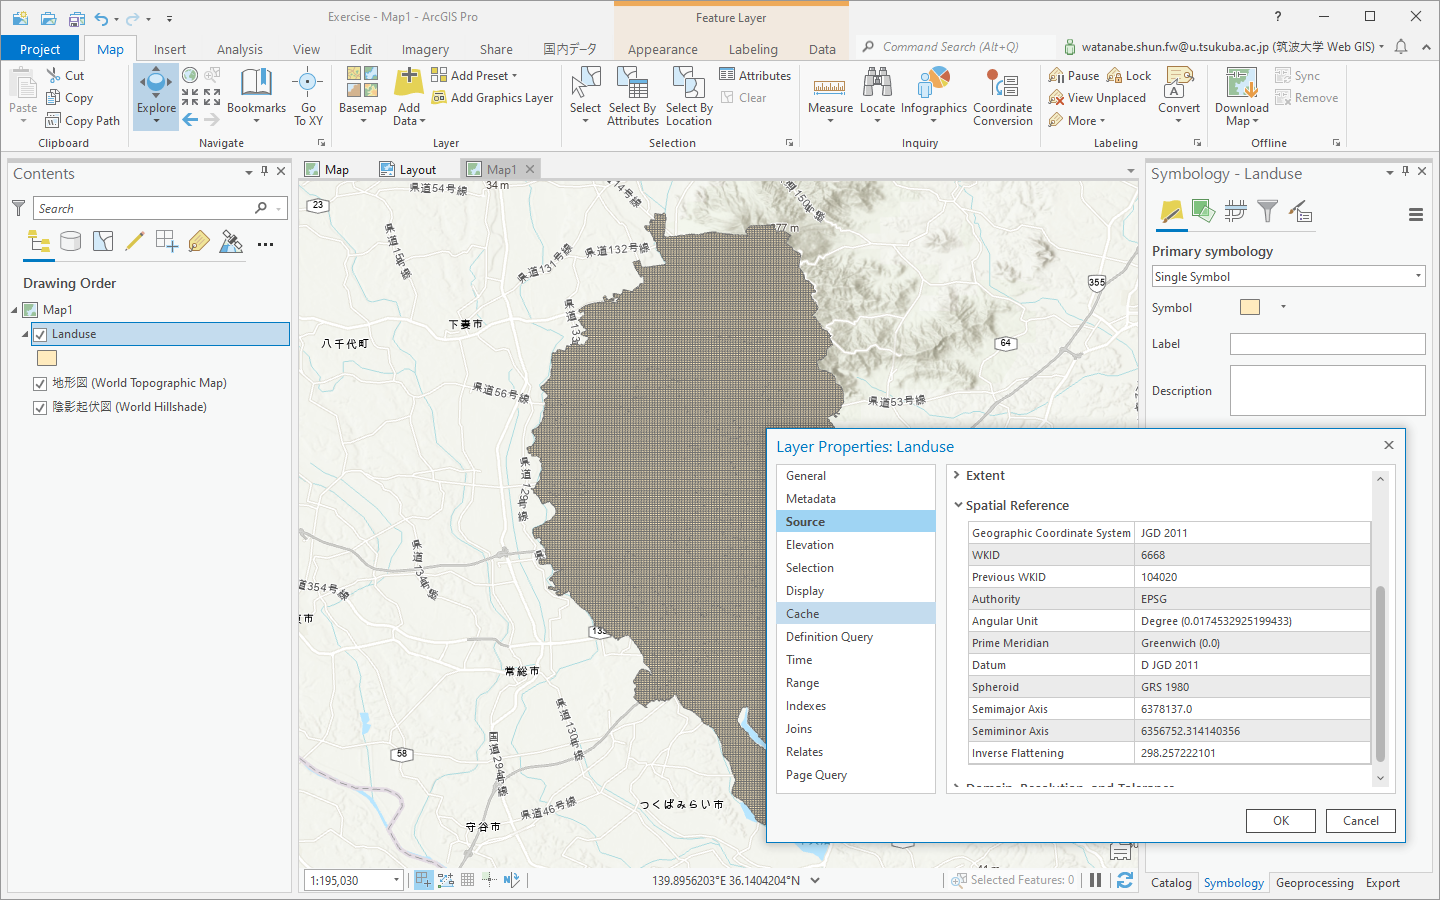
- Select "Landuse" layer in Contents window.
- Open "Properties" from popup menu.
- Select "Source" in the menu and expand Spatial Reference.
- Confirm this data is constracted based on JGD 2011 (longitude and latitude)
- The map is also drawn according to JGD 2011
- Close Layer Properties.
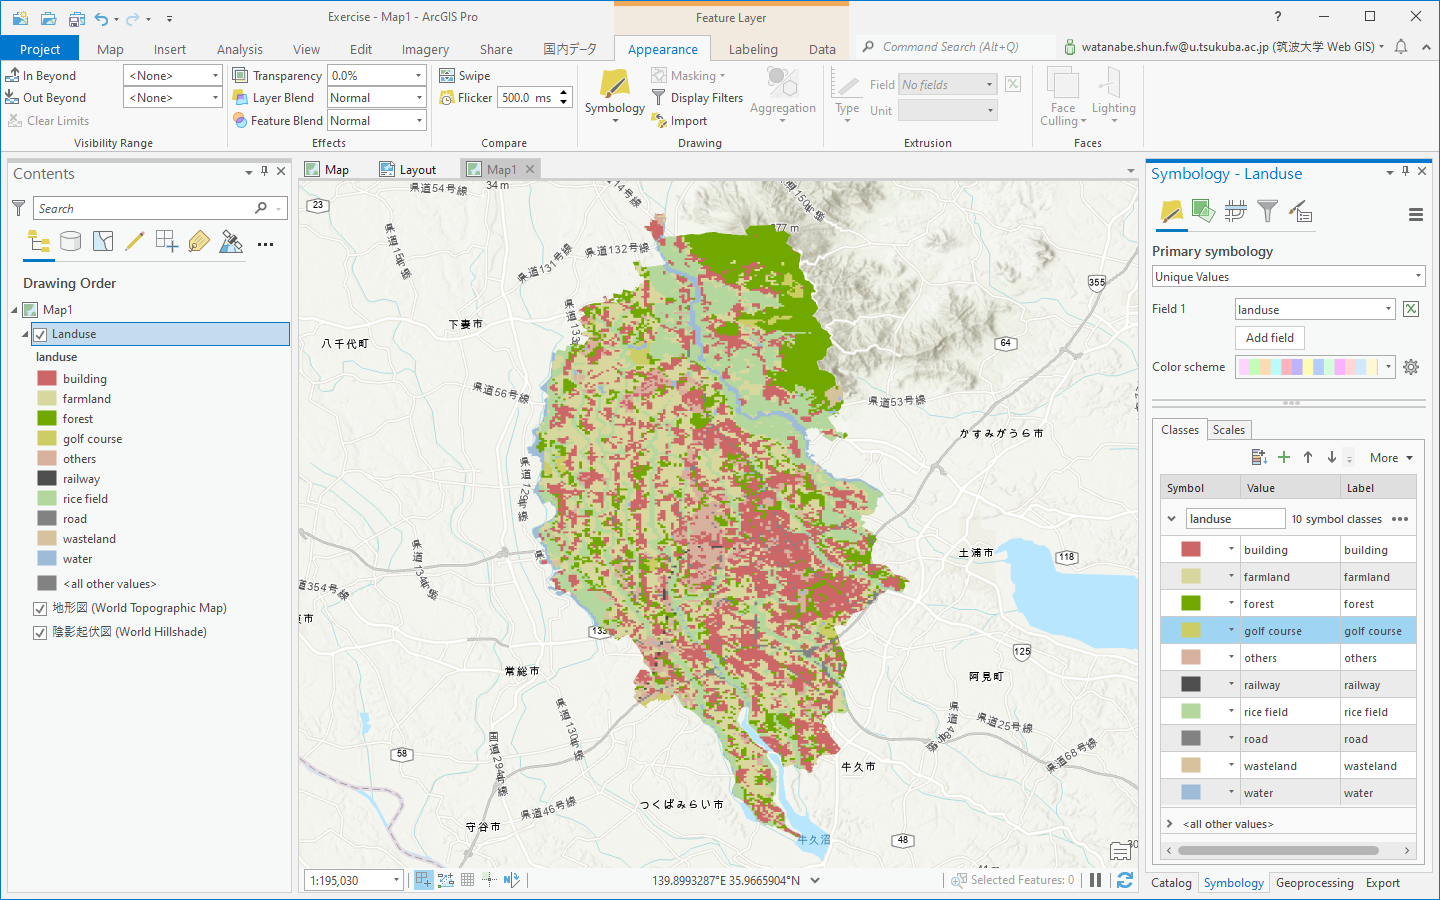
- Select "Landuse" layer in Contents window.
- Select "Symbology" from popup menu.
- Select Unique Values in Primary symboloty, and "landuse" for Field 1.
- Click .
 "Add All Values"
 - Double-click on each symbol color, and change the color appropliately.
- From "New Map" of Insert tab, make a New Map.
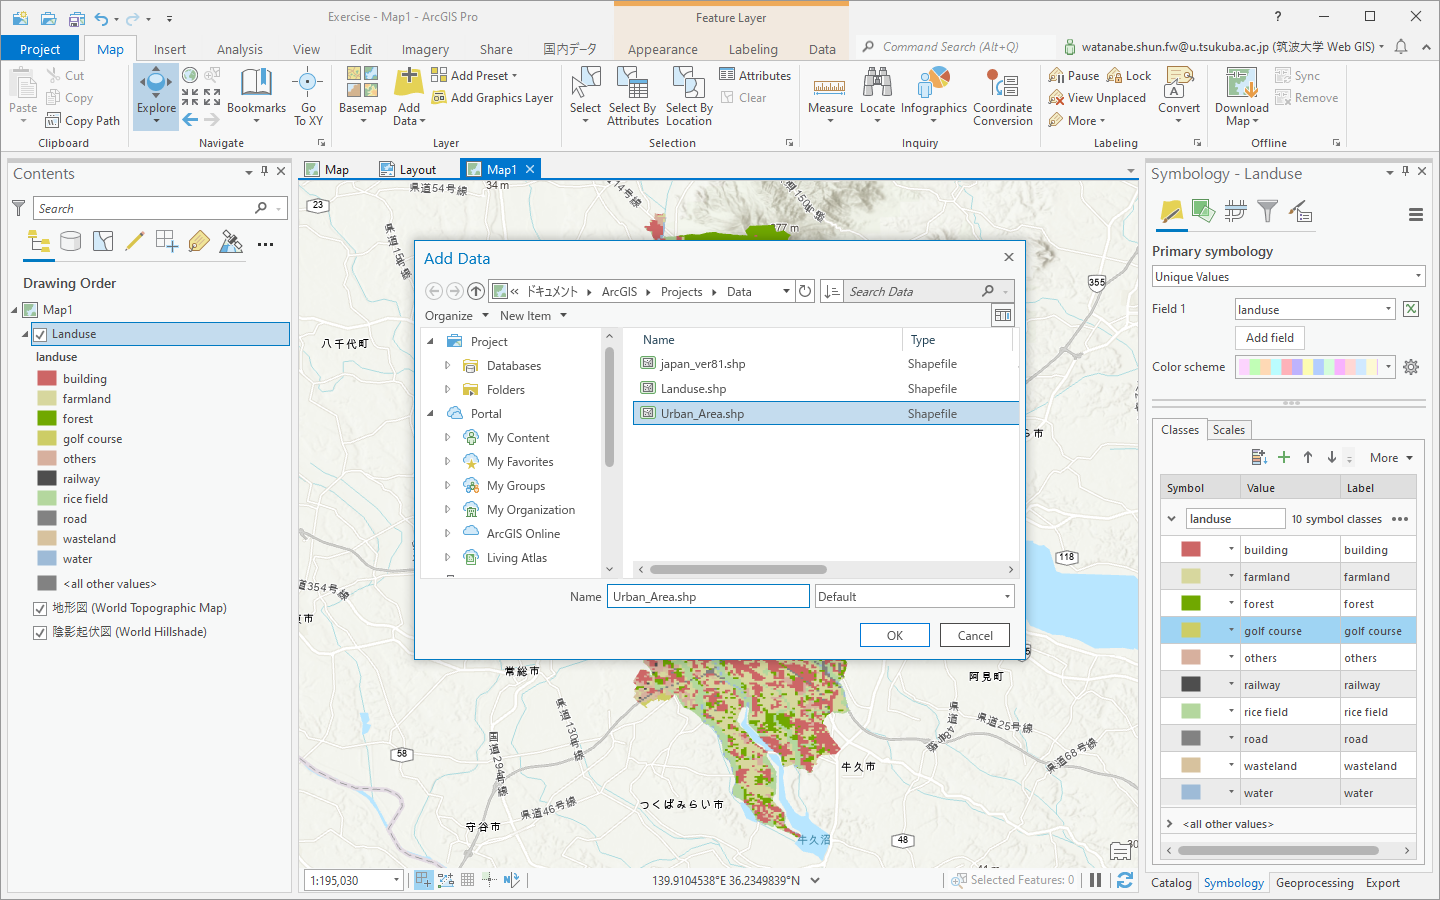
- Open "Add Data" dialog box from Map tab
- Select "Urban_Area.shp" database, and add it as a layer to Contents window.
- Also open "Properties" and Confirm this data is constracted based on JGD 2011.
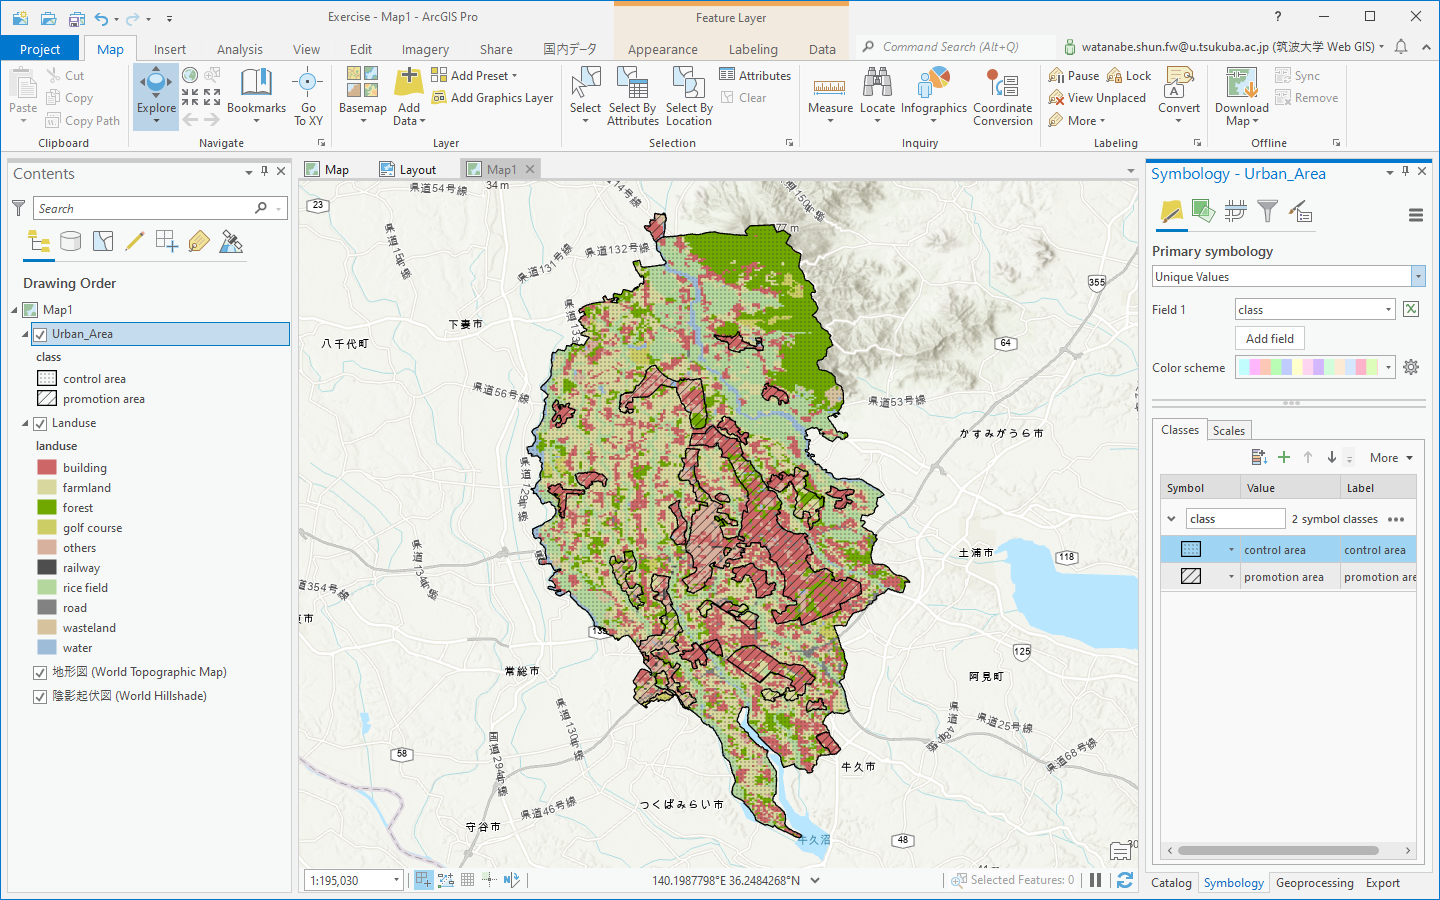
- Select "Urban_Area" layer in Contents window.
- Select "Symbology" from popup menu.
- Select Unique Values in Primary symboloty, and "class" for Field 1.
- Click . "Add All Values".
- Double-click on each symbol color, and change to the transparent pattern appropliately.
- Confirm the relation between actual landuse and urban area regulation.
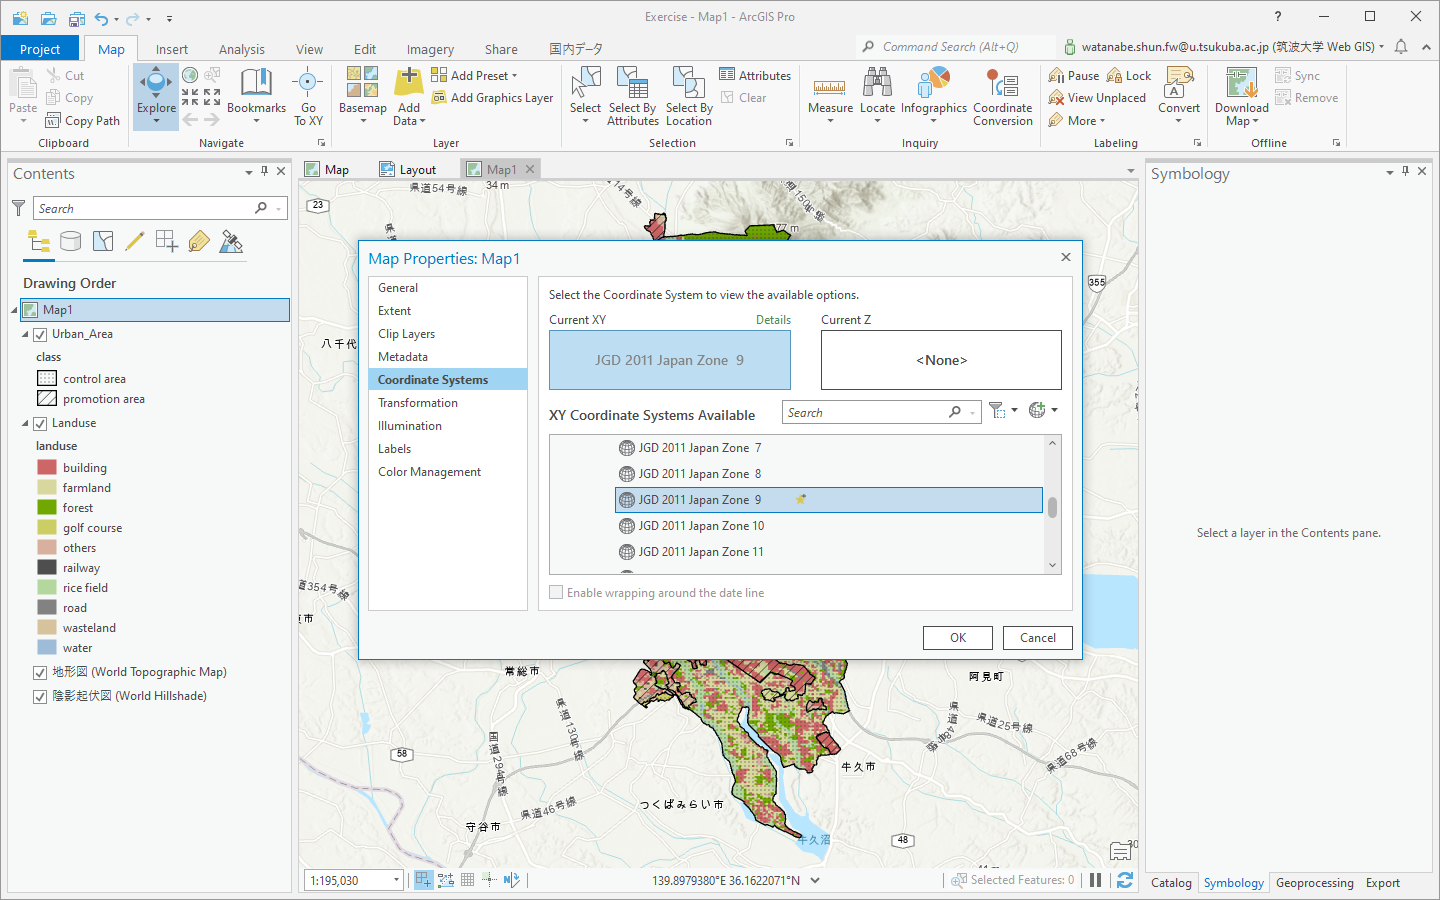
- Select "Map 1" in Contents window.
- Open "Properties" from popup menu
- Select "Coordinate Systems" in the menu
- Select "Projected Coordinate Systems / National Grids / japan / JGD 2011 Japan Zone 9"
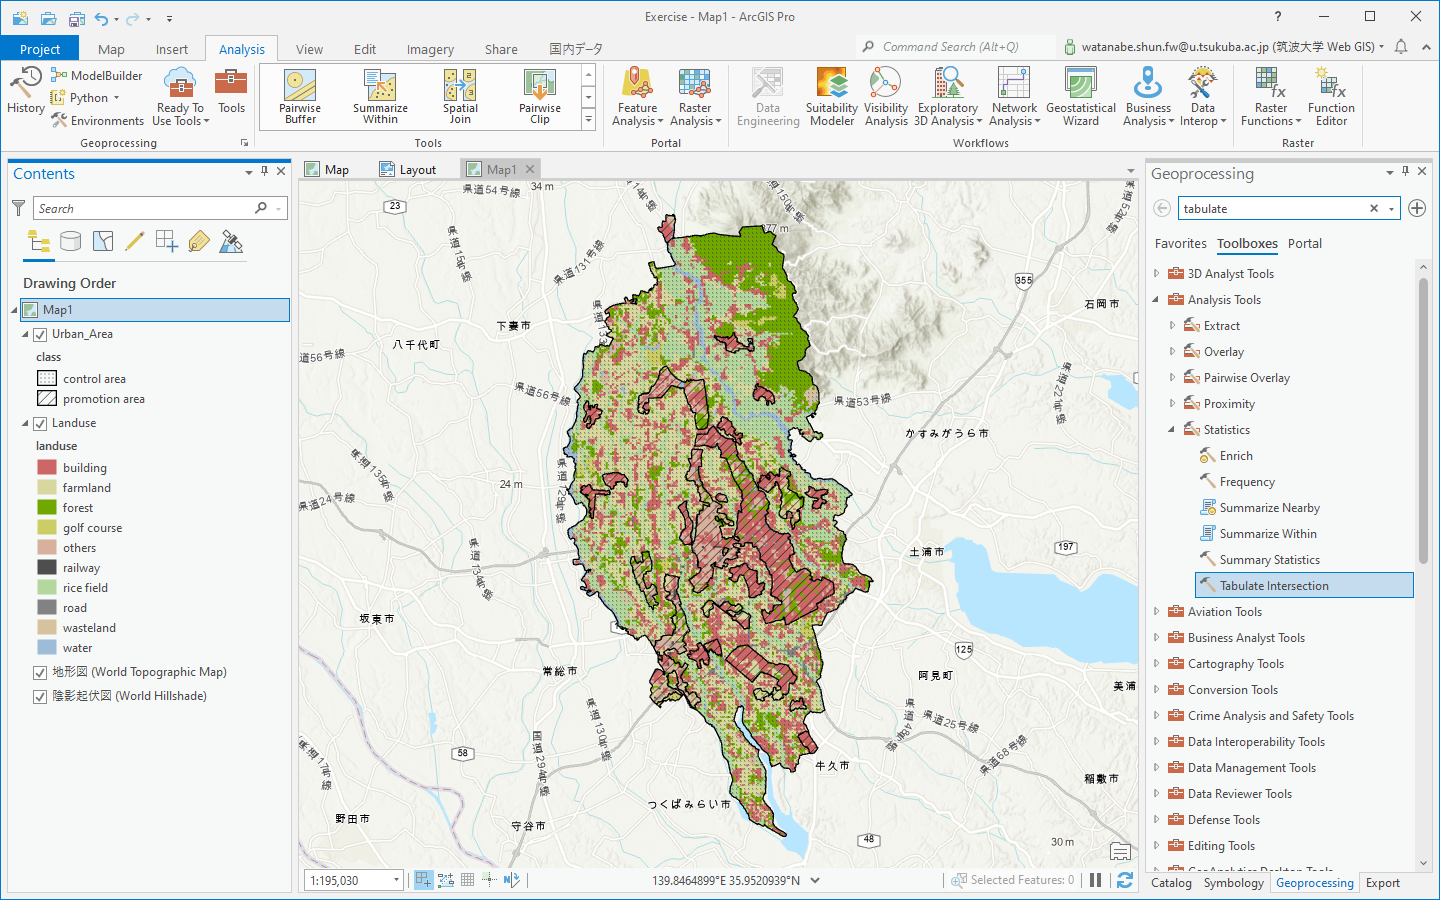
- Click "Tools" of Analysis tab to open Geoprocessing window.
- Select "Toolboxes" to list up Tools
- Expand Analysis Tools / Statistics and open "Tabulate Intersection" window.
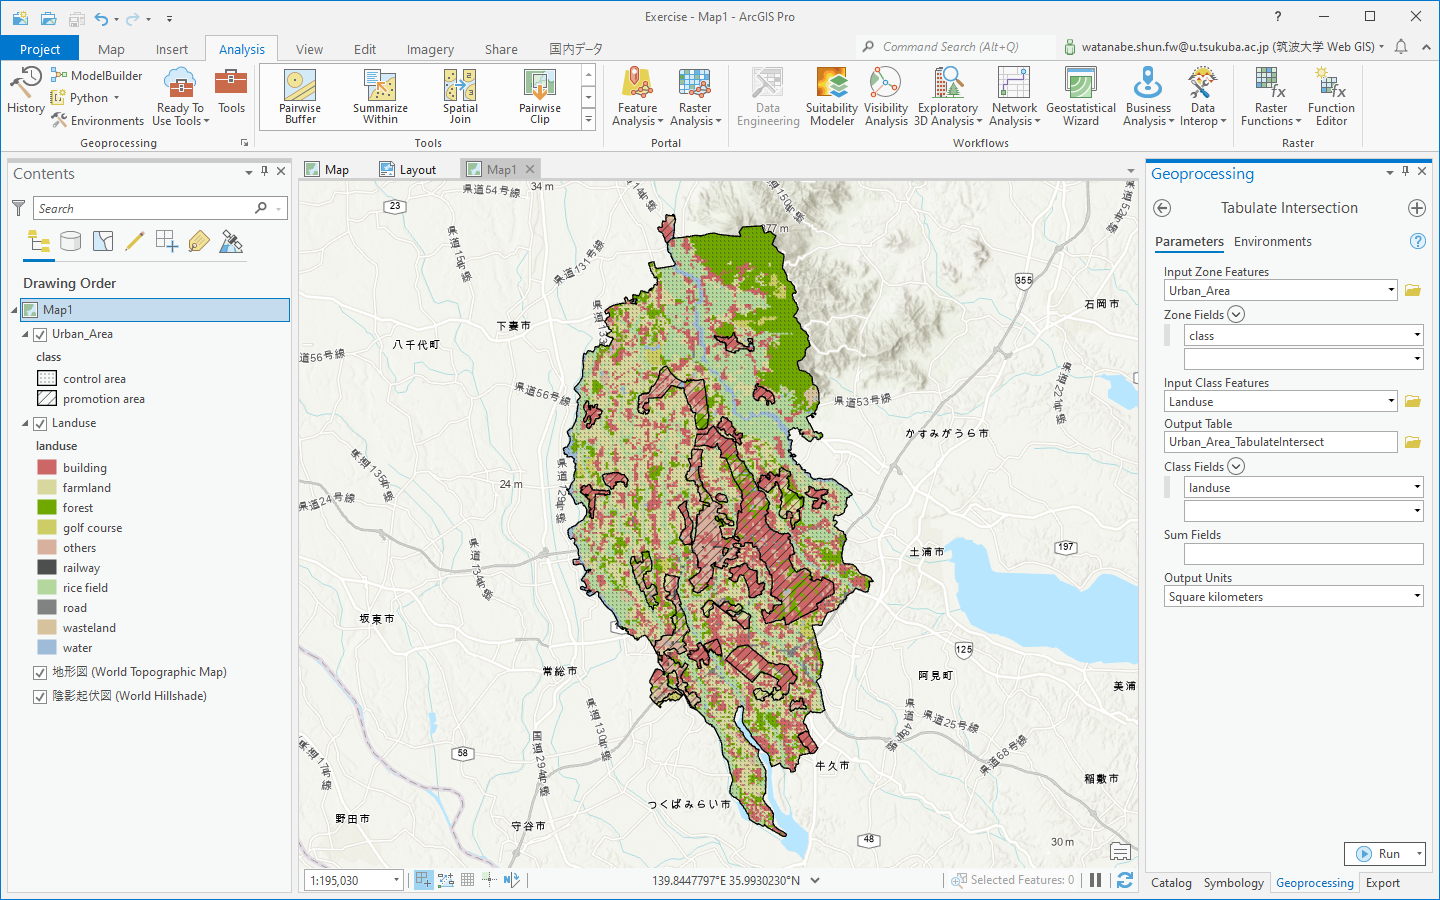
- Select paramers in the Tabulate Intersectioin dialog gox
> Input Zone Features : Urban_Area
> Zone Fields : class
> Input Class Features : Landuse
> Output Talbe : name as you like (the defualt is OK)
> Class Fields : landuse
> Output Units (optional) : SQUARE_KIROMETERS
- Click "Environment" at the top of "Tabulate Intersection" window.
- Select "Current Map[Map]" as Output Coortdinate System
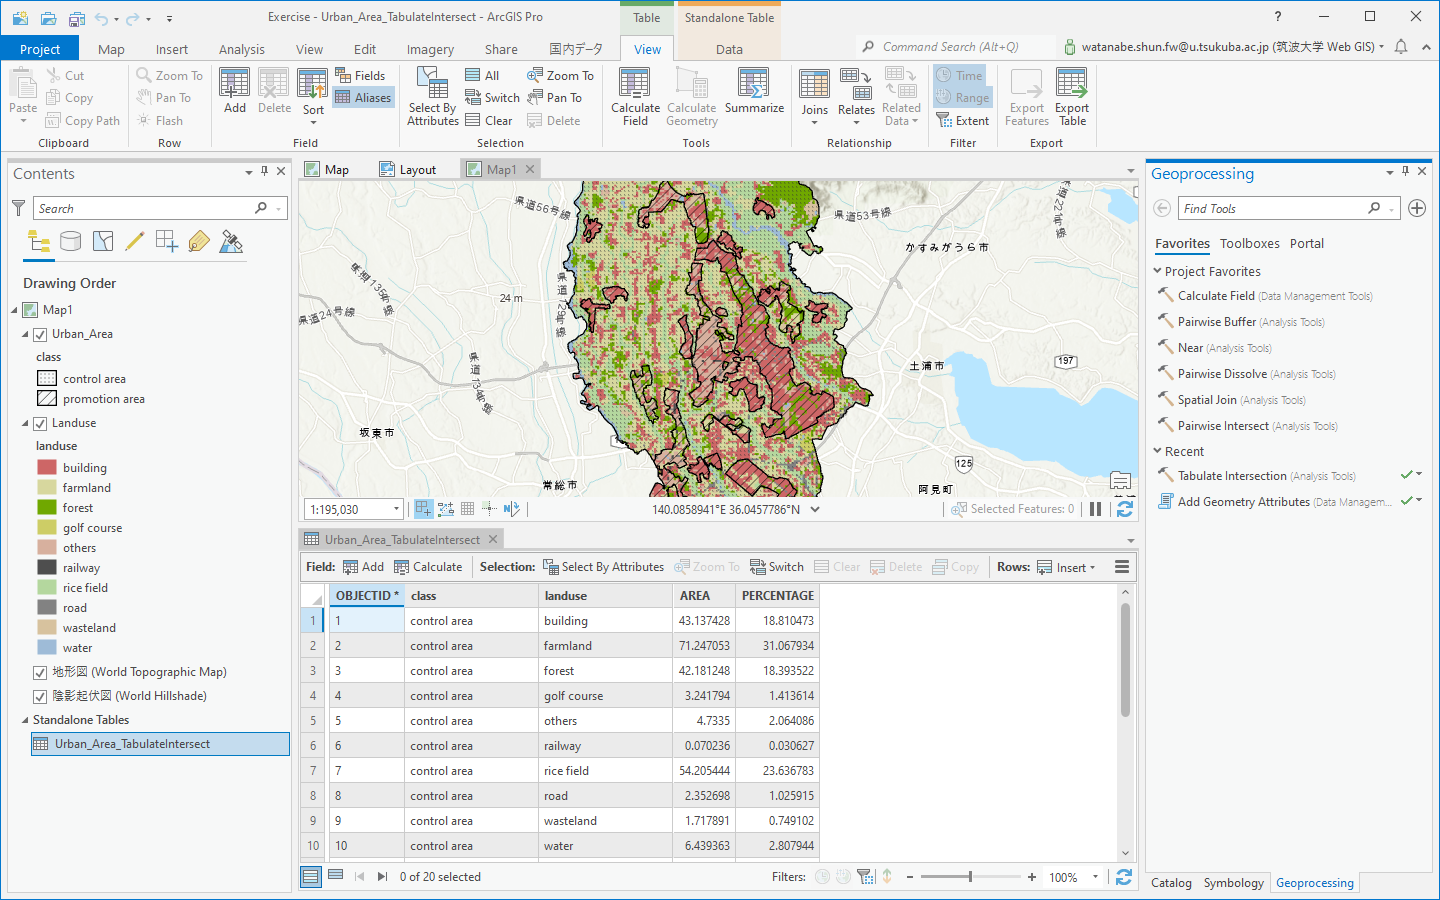
- Run to calcuate the cross tabulation..

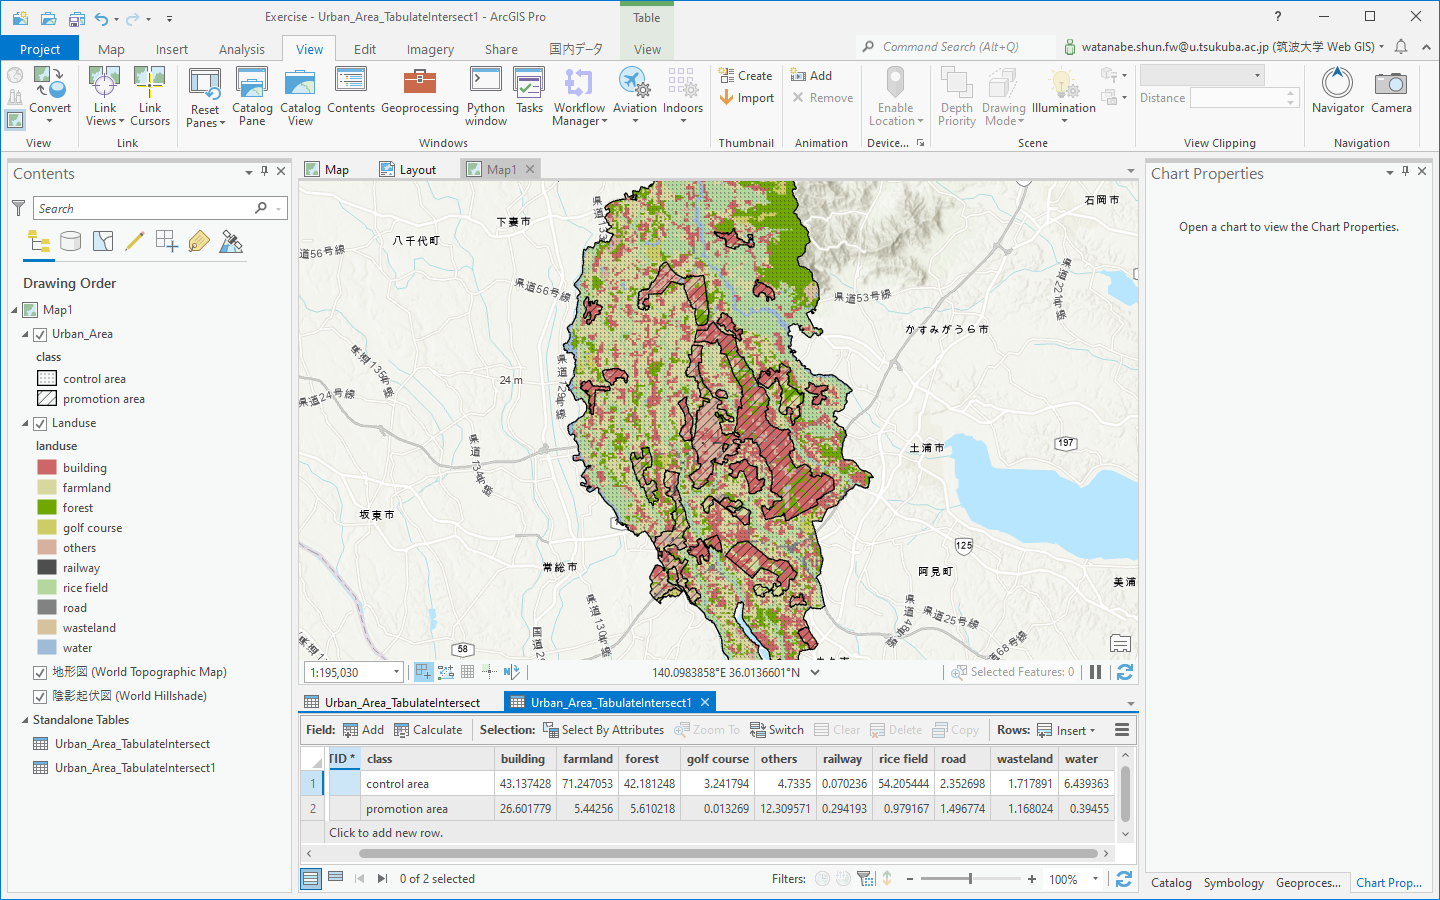
- Select the generated table in Contents window.
- "Open" the table from popup menu.
- Confirm the result of cross tabulation.
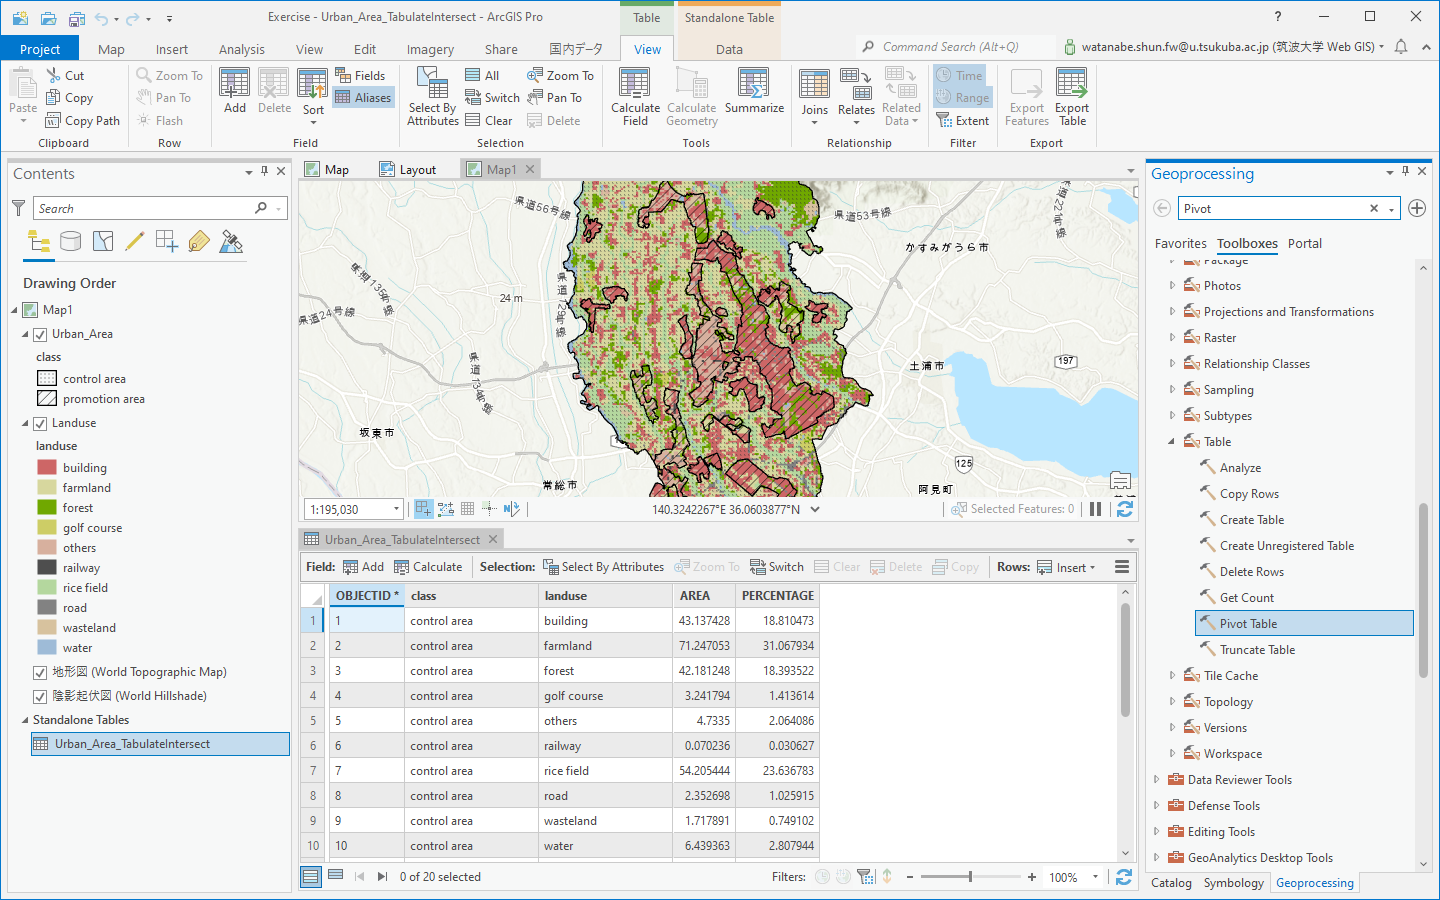
- Click "Tools" of Analysis tab to open Geoprocessing window.
- Select "Toolboxes" to list up Tools
- Expand Data Management Tools / Table and open "Pivot Table" window.
- Select paramers in the Pivot Table window
> Input Table : the Table just you made
> Input Field(s) : class
> Pivot Field : landuse
> Value Fields : Area
> Output Table: name as you like (the defualt is OK)

- Select the generated pivot table in Contents window.
- "Open" the table from popup menu.
- Confirm how table is transformed.
- Close the Table window.
- Select the generated pivot table in Contents window.
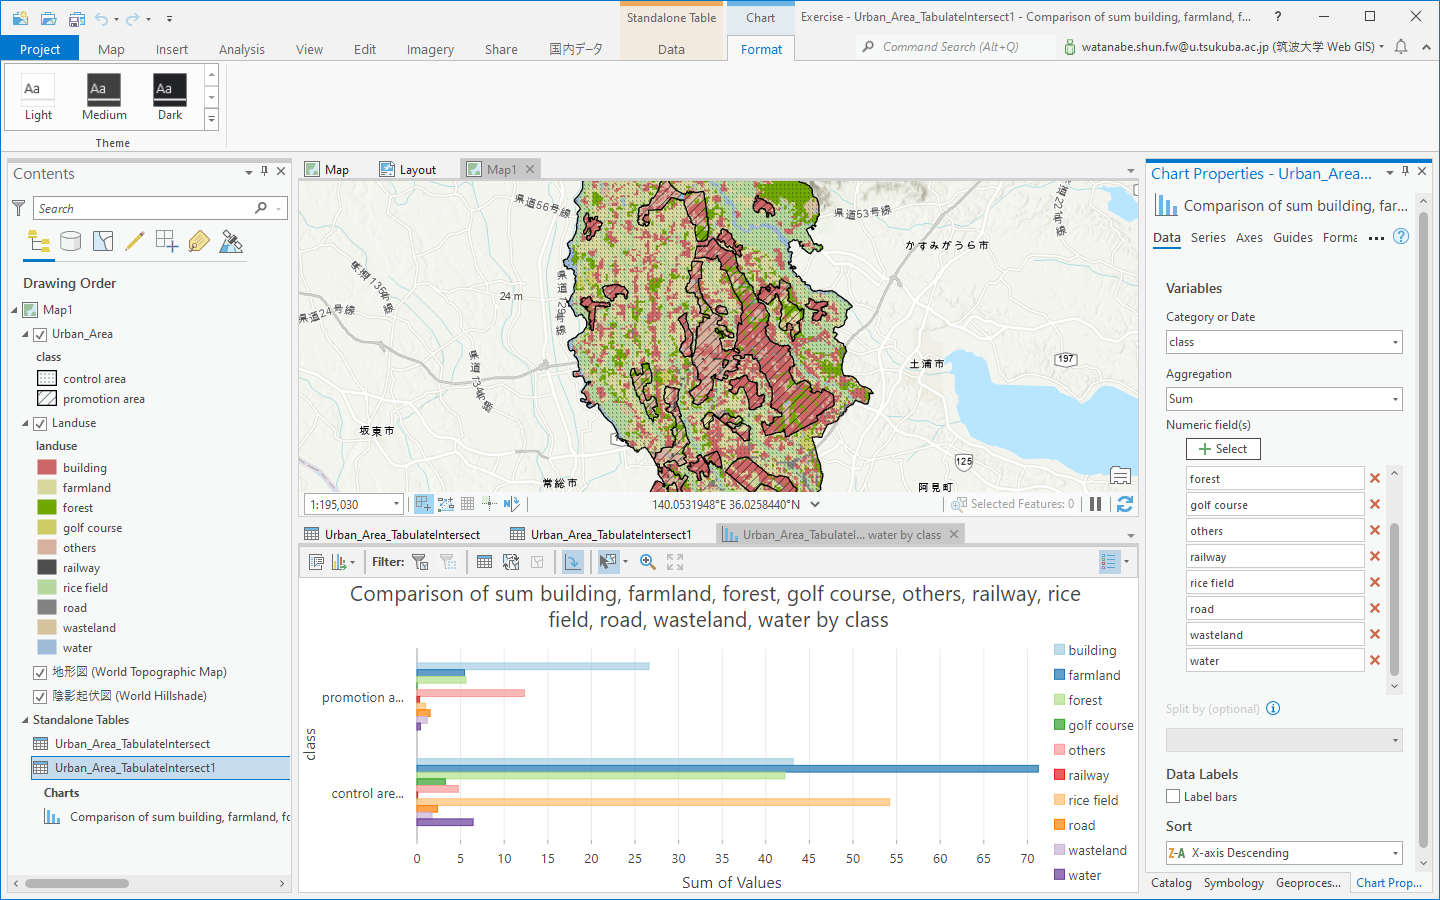
- Select "Create Chart / Bar Chart" from popup menu.
- Select paramers in the Chart Properties window
> Category or Date : class
> Aggregation : <none>
> Numeric fields : All except OBJECT ID
> Sort: X-axis Decending - Rotete Chart
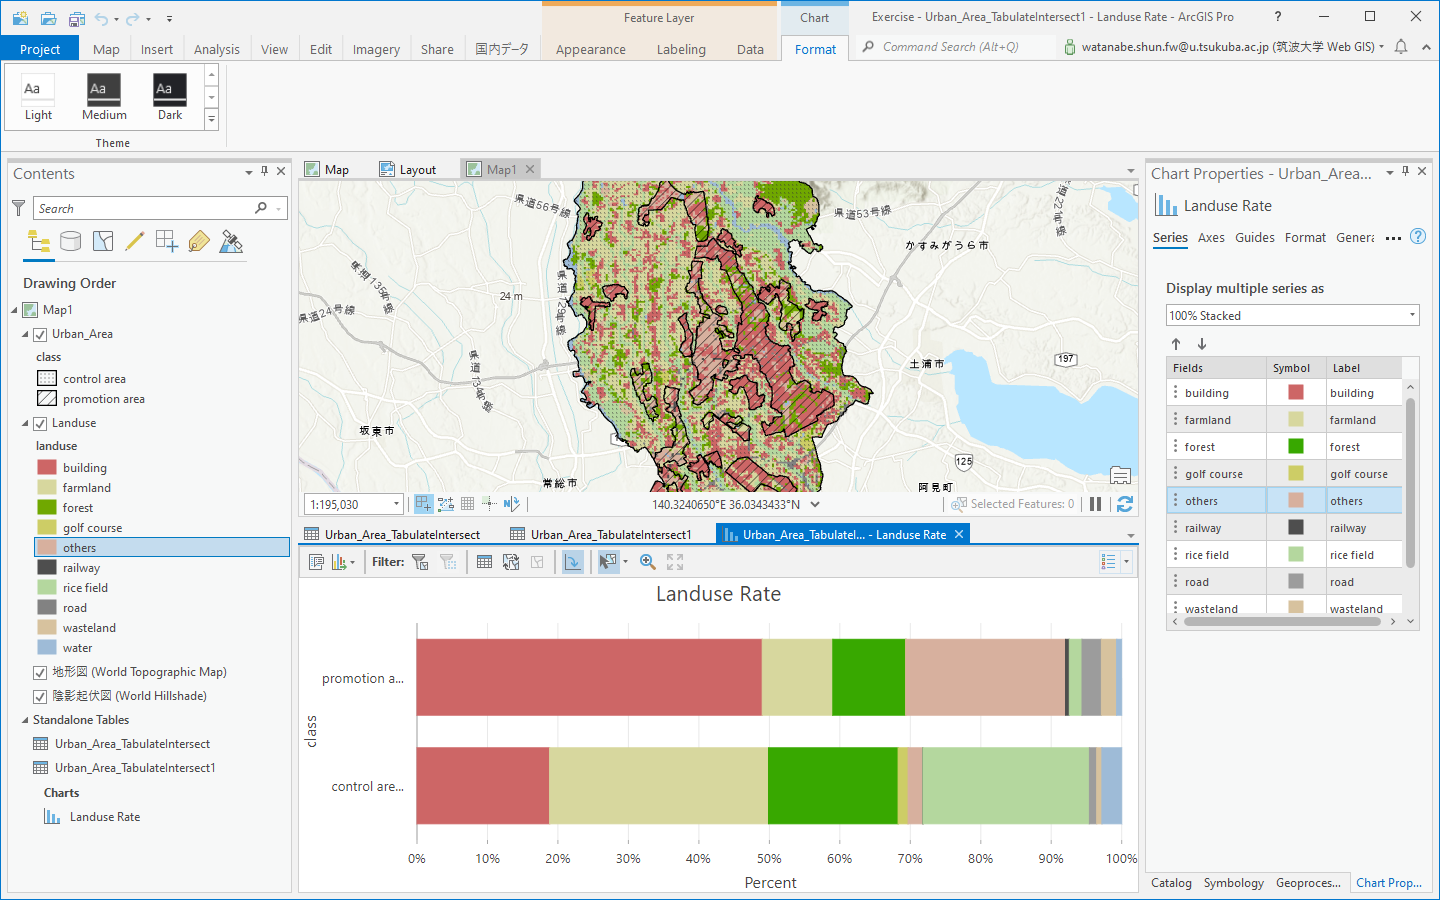
- Click "Series" at the top of Chart Properties window.
- Select Display Multiple series as "100% Stacked"
- Change Symbol color according to the legend of Landuse layer.
- Open "New Layout" of Insert tab and select ISO Portrait A4 .
- Select "Map Frame" and locat the map on the A4 paper.
- Insert "Legend", "North Arrow", "Chart Frame" to complete the Map.
- Select "Export Output" of Share tab
- Name the file name and Export as PNG file.
- Submit the png file to manaba.